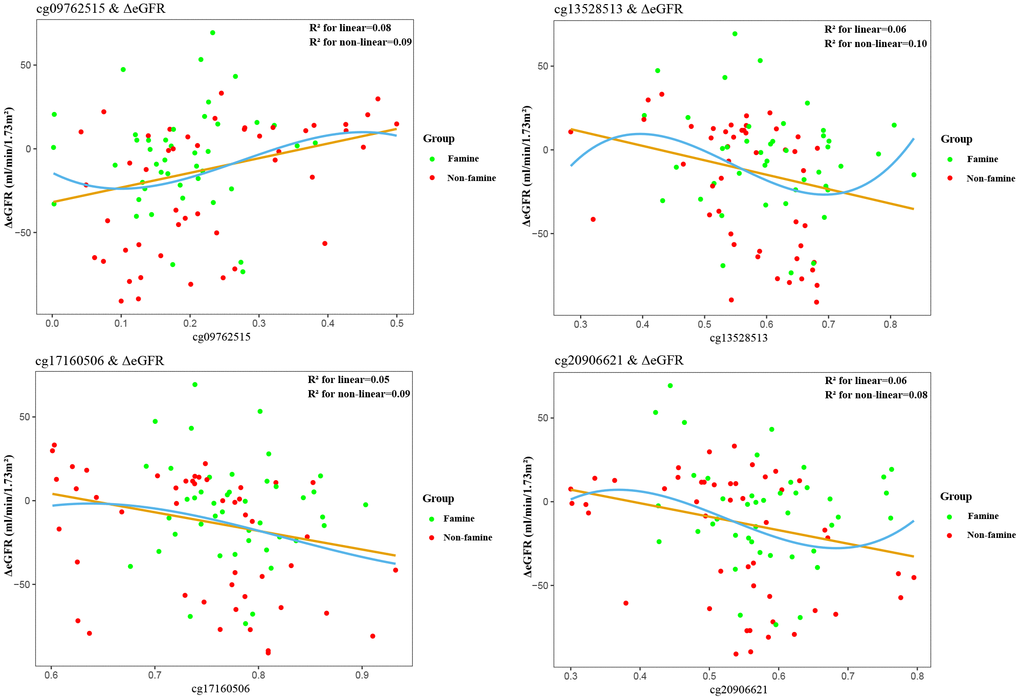
Figure 2.Association between epigenetic dysregulation in parental blood and ΔeGFR after fetal malnutrition. Correlation graphs of (y axis) ΔeGFR and (x axis) β values showing association between DNA methylation on cg09762515 (A), cg13528513 (B), cg17160506 (C), cg20906621 (D)and ΔeGFR in F1 generation.