Submit an Article
Navigate
Home
Editorial Board
Editorial Policies
Current Volume
Archive
Scientific Integrity
Publication Ethics Statements
Interviews with Outstanding Authors
Newsroom
Sponsored Conferences
Podcast
Contact
Special Collections
Submit an Article
Online ISSN: 1945-4589
Research Paper
|
Volume 12, Issue 17
|
pp. 16775–16802
Identification of cardiovascular health gene variants related to longevity in a Chinese population
Back to article
Figure 4
(6 of 6)
−
100%
+
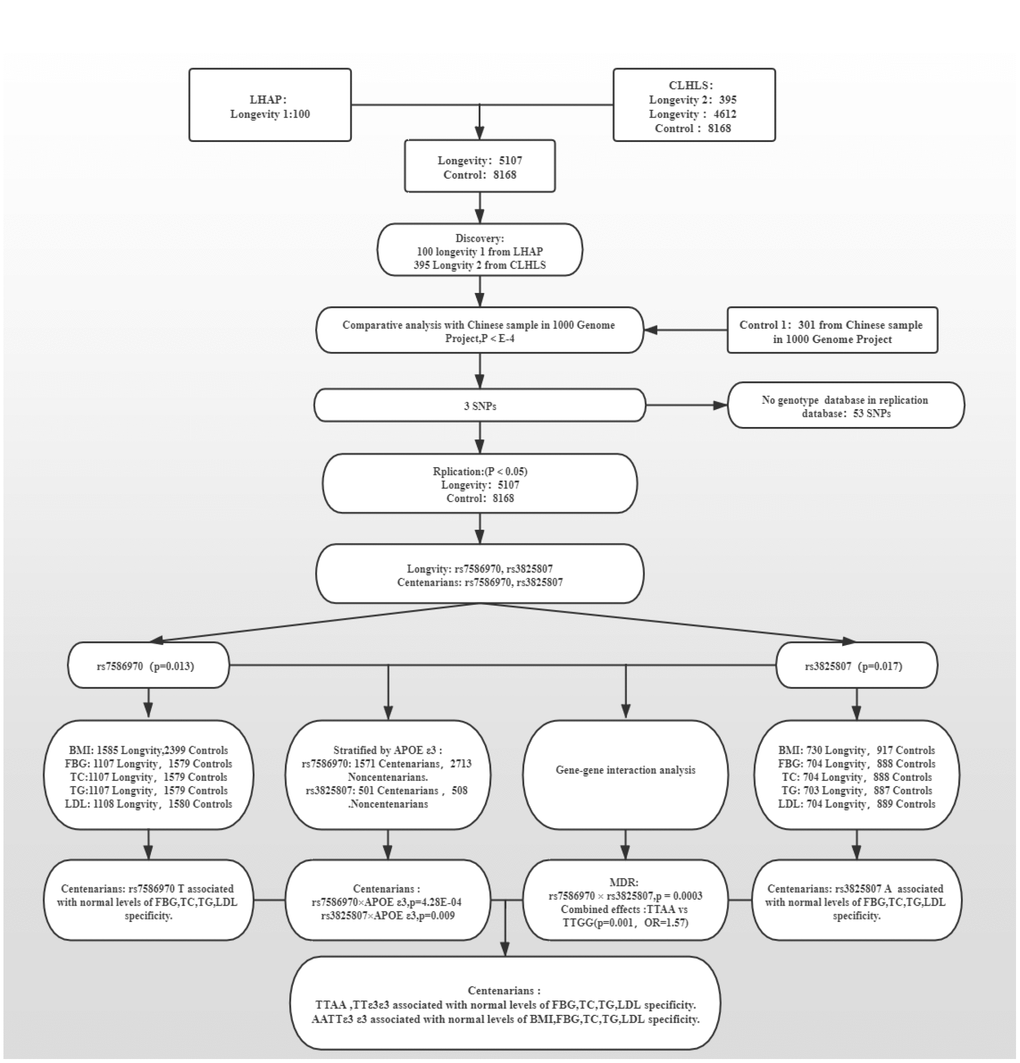
Figure 4.
A flow chart of the consecutive analysis steps.