Submit an Article
Navigate
Home
Editorial Board
Editorial Policies
Current Volume
Archive
Scientific Integrity
Publication Ethics Statements
Interviews with Outstanding Authors
Newsroom
Sponsored Conferences
Podcast
Contact
Special Collections
Submit an Article
Online ISSN: 1945-4589
Research Paper
|
Volume 12, Issue 12
|
pp. 11967–11989
Establishment of a novel risk score model by comprehensively analyzing the immunogen database of bladder cancer to indicate clinical significance and predict prognosis
Back to article
Figure 2
(2 of 10)
−
100%
+
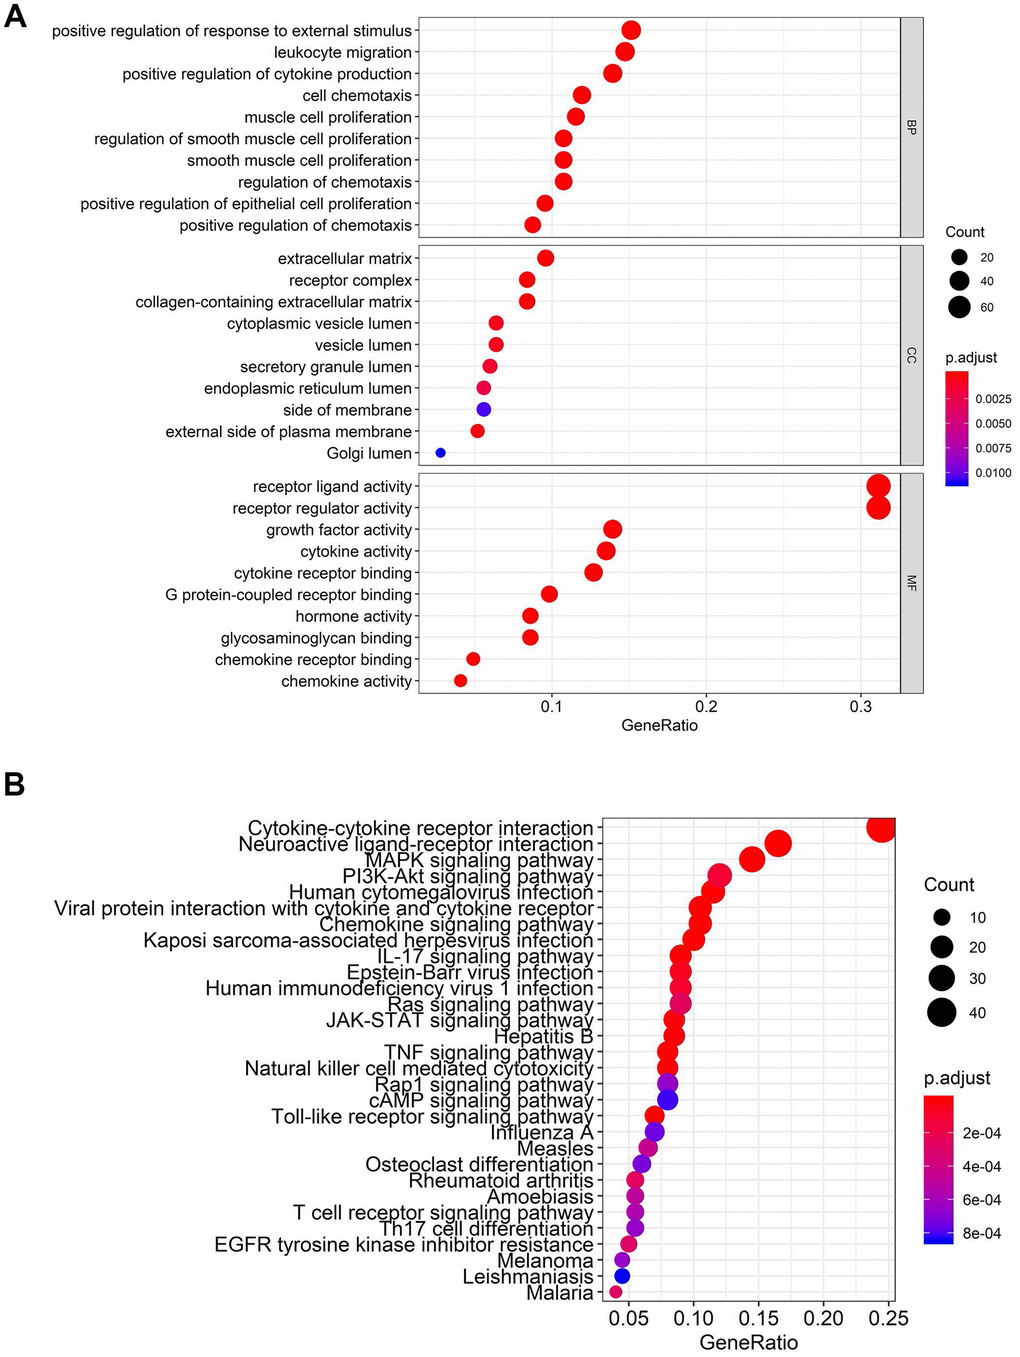
Figure 2.
Functional enrichment analysis of differentially expressed IFRGs.
The top pathways of IFRGs are shown in biological process, cellular component, molecular function (
A
), and KEGG pathway (
B
).