Submit an Article
Navigate
Home
Editorial Board
Editorial Policies
Current Volume
Archive
Scientific Integrity
Publication Ethics Statements
Interviews with Outstanding Authors
Newsroom
Sponsored Conferences
Podcast
Contact
Special Collections
Submit an Article
Online ISSN: 1945-4589
Research Paper
|
Volume 12, Issue 12
|
pp. 11893–11913
Association of the
NCAN-TM6SF2-CILP2-PBX4-SUGP1-MAU2
SNPs and gene-gene and gene-environment interactions with serum lipid levels
Back to article
Figure 7
(7 of 7)
−
100%
+
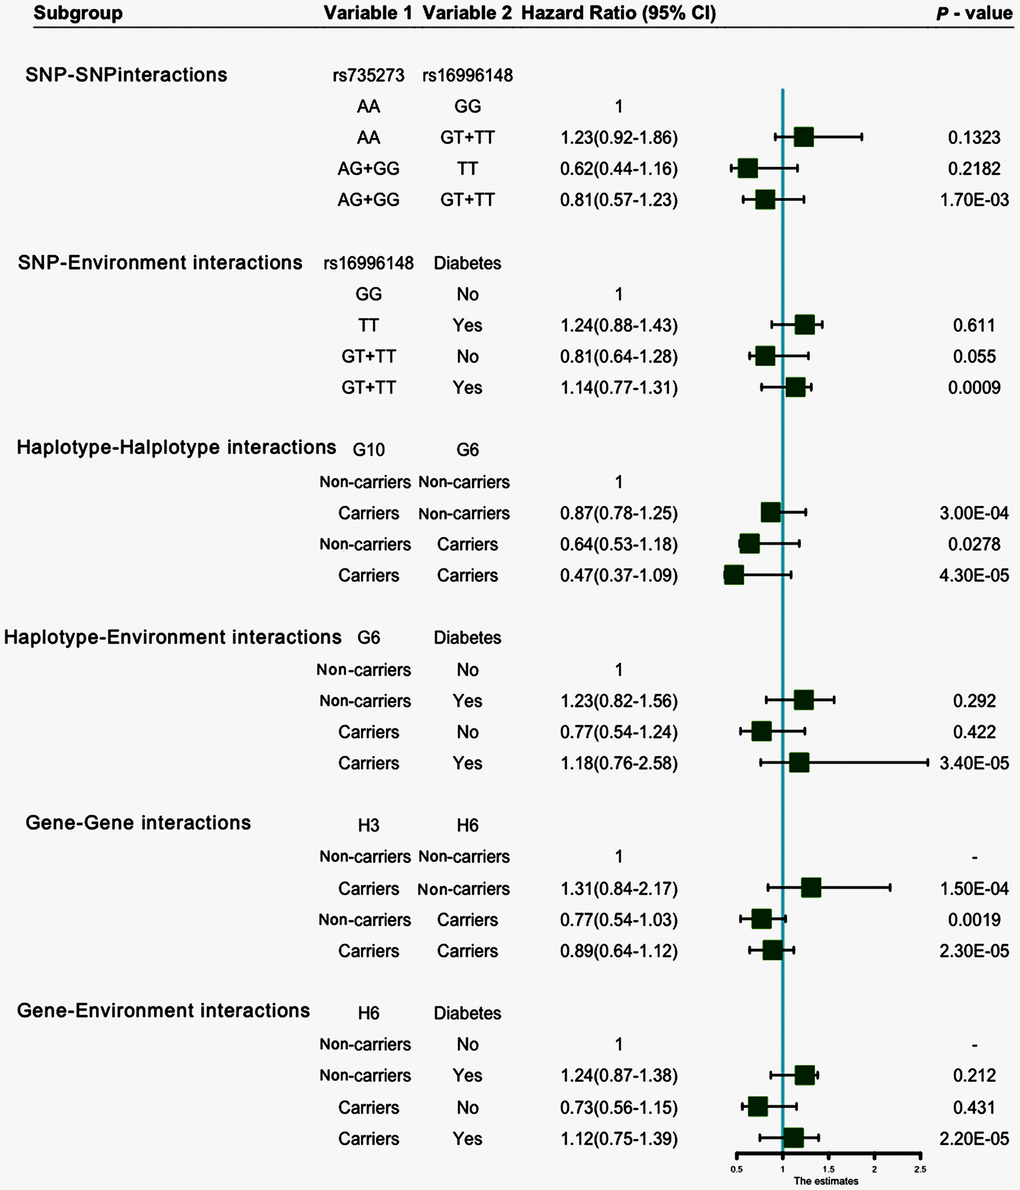
Figure 7.
SNP-SNP, SNP-environment, haplotype-haplotype, haplotype-environment, gene-gene and gene-environment interactions on the risk of hyperlipidemia.