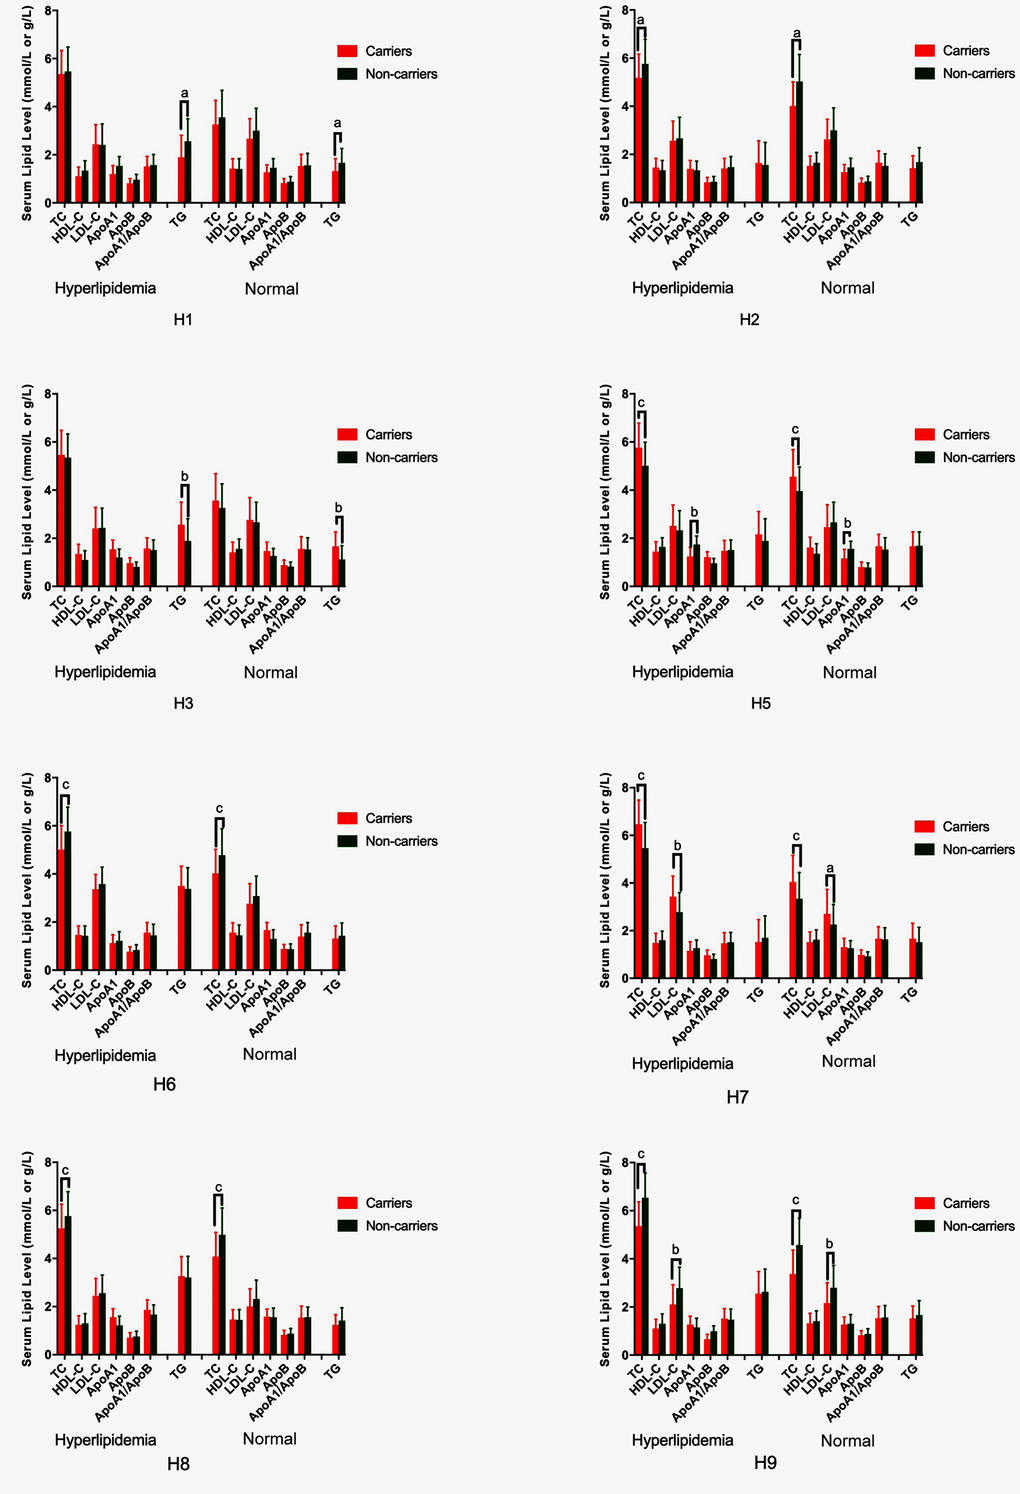
Figure 5.G × G haplotype-based association with serum lipid levels in normal and hyperlipidemic individuals. TC, total cholesterol; HDL-C, high-density lipoprotein cholesterol; LDL-C, low-density lipoprotein cholesterol; ApoA1, apolipoprotein A1; ApoB, apolipoprotein B; TG, triglyceride. aP < 0.006, bP < 0.001, and cP < 0.0001.