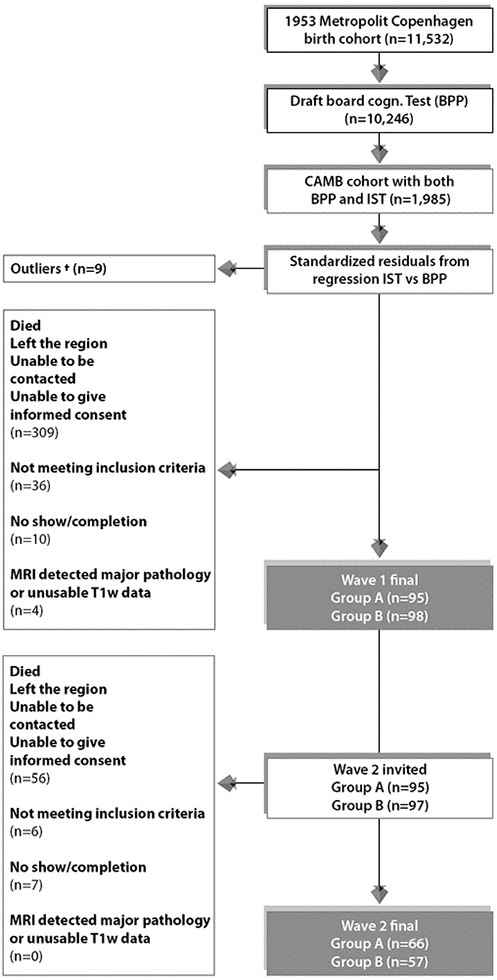
Figure 6.Subject selection process for Wave 1/W-57 and Wave 2/W-63. To avoid effects of extreme test scores, subjects with standardized residuals ±3 were omitted defined as here as †. The final sample size for the current study includes n=123 subjects who completed wave 1 and wave 2. Group A = 66 improvers and Group B = 57 decliners.