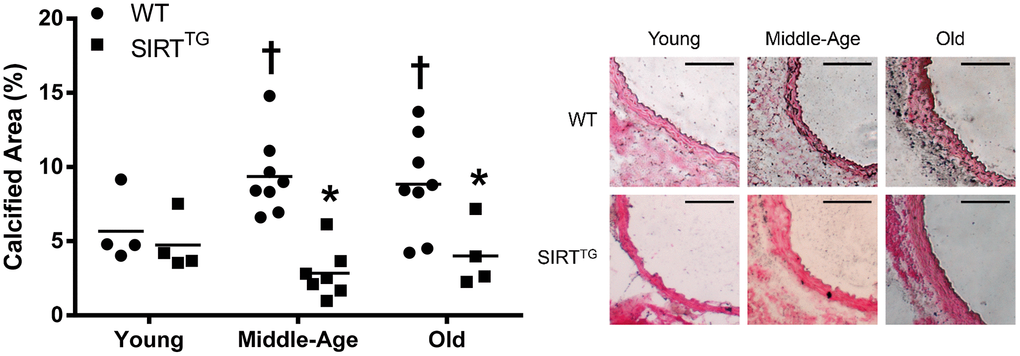
Figure 4.Calcified area relative to tunica media area in young, middle-age, and old wild-type (WT) and SIRT-1 transgenic overexpressing (SIRTTG) mice. Figure is accompanied by representative images. Black scale bars are equal to 100 μm. *P<0.05 vs. WT. †P<0.05 vs. Young. Data are individual values and means.