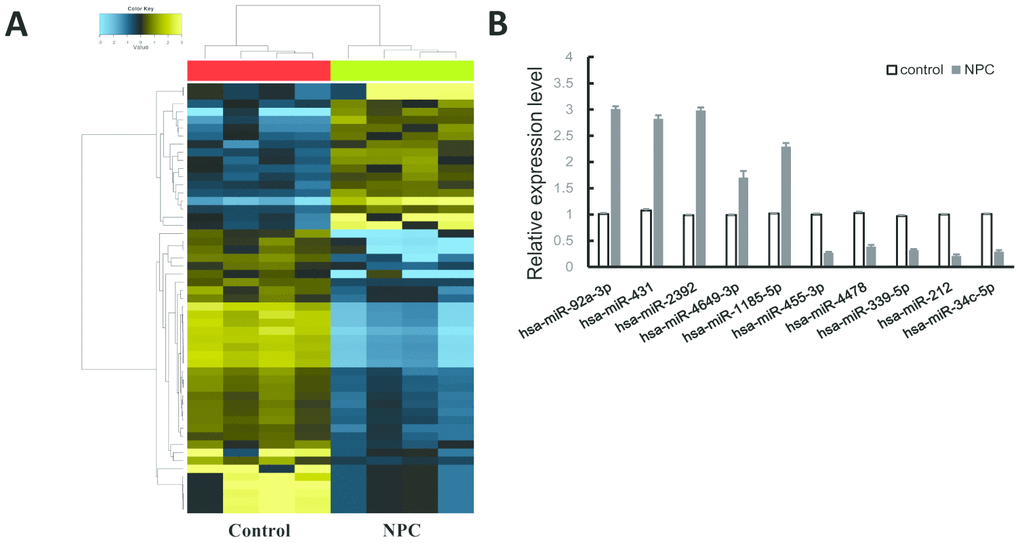
Figure 1.MiRNAs expression profile in NPC. (A) Heatmap of the differentially expressed miRNAs. Yellow for the up-regulated miRNAs and blue for down-regulated miRNAs. (B) QRT-PCR validation of 10 randomly selected miRNAs.
Figure 1 — Integrative analysis of miRNAs-mRNAs reveals that miR-182 up-regulation contributes to proliferation and invasion of nasopharyngeal carcinoma by targeting PTEN | Aging