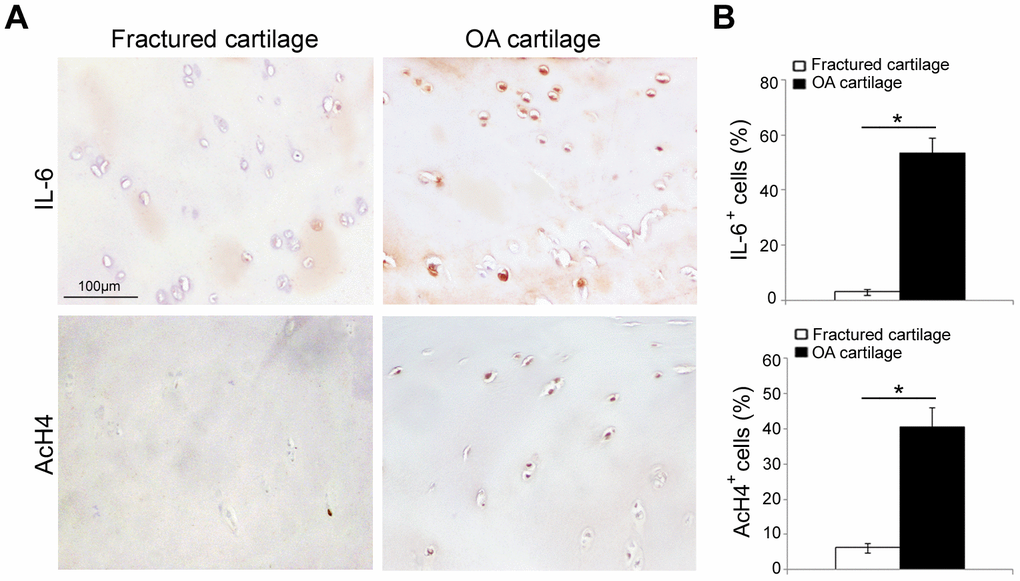
Figure 2.IL-6 and AcH4 expression in articular cartilage of fractured and OA patients. (A) Representative immunohistochemical images of IL-6 and AcH4 expression in femoral cartilage of fractured (n=30) and OA patients (n=30). (B) Bar graphs show semi-quantitative evaluation of IL-6 and AcH4. Results are expressed as mean values ± SEM. Student’s t-test: *P < 0.001.