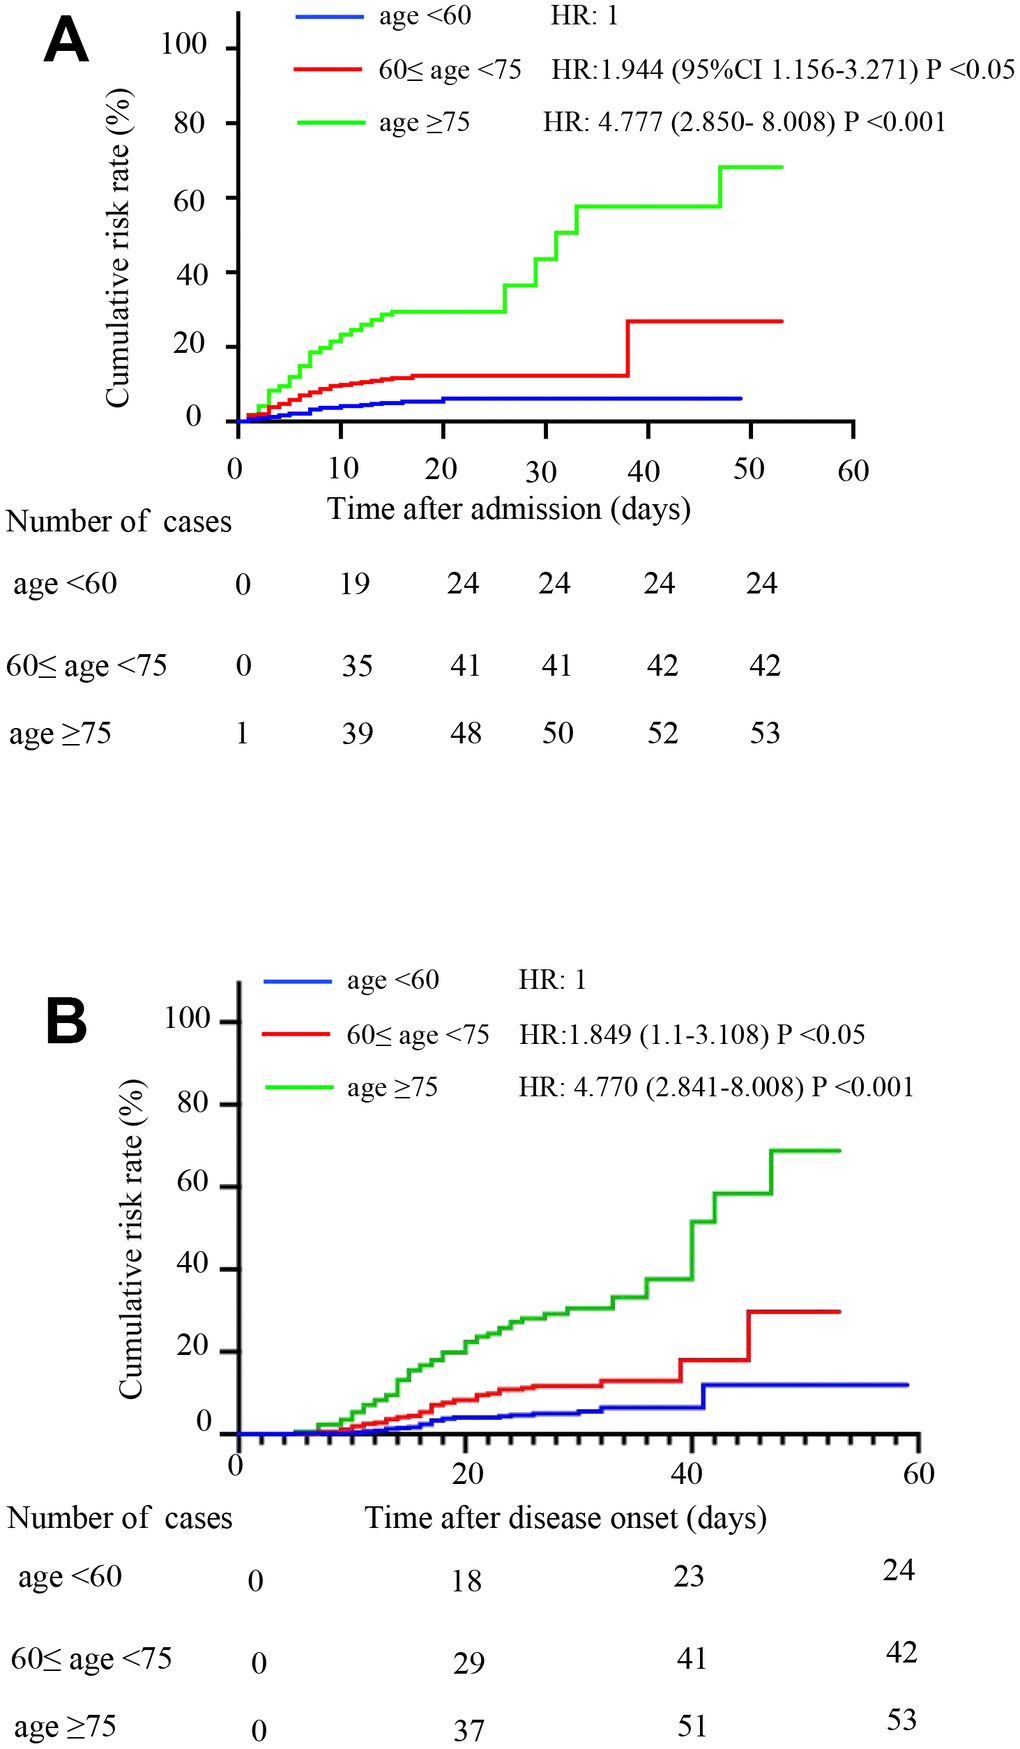
Figure 1.Comparison of the time-dependent risk of death. (A) The cumulative death risk after admission in age group 1 (blue curve), age group 2 (red curve) and age group 3 (green curve). Compared to age group 1, the hazard ratios (HRs) and 95% confidence intervals (95% CIs) of age groups 2 and 3 were HR: 1.944 (1.156-3.271; P <0.05) and HR: 4.777 (2.850- 8.008; P <0.001), respectively. The model was adjusted for sex and comorbidities. (B) The cumulative death risk after disease onset in age group 1 (blue curve), age group 2 (red curve) and age group 3 (green curve). Compared to age group 1, the HRs (95% CIs) of age groups 2 and 3 were HR: 1.849 (1.1-3.108; P <0.05) and HR: 4.77 (2.841-8.008; P <0.001). The model was adjusted for sex and comorbidities.