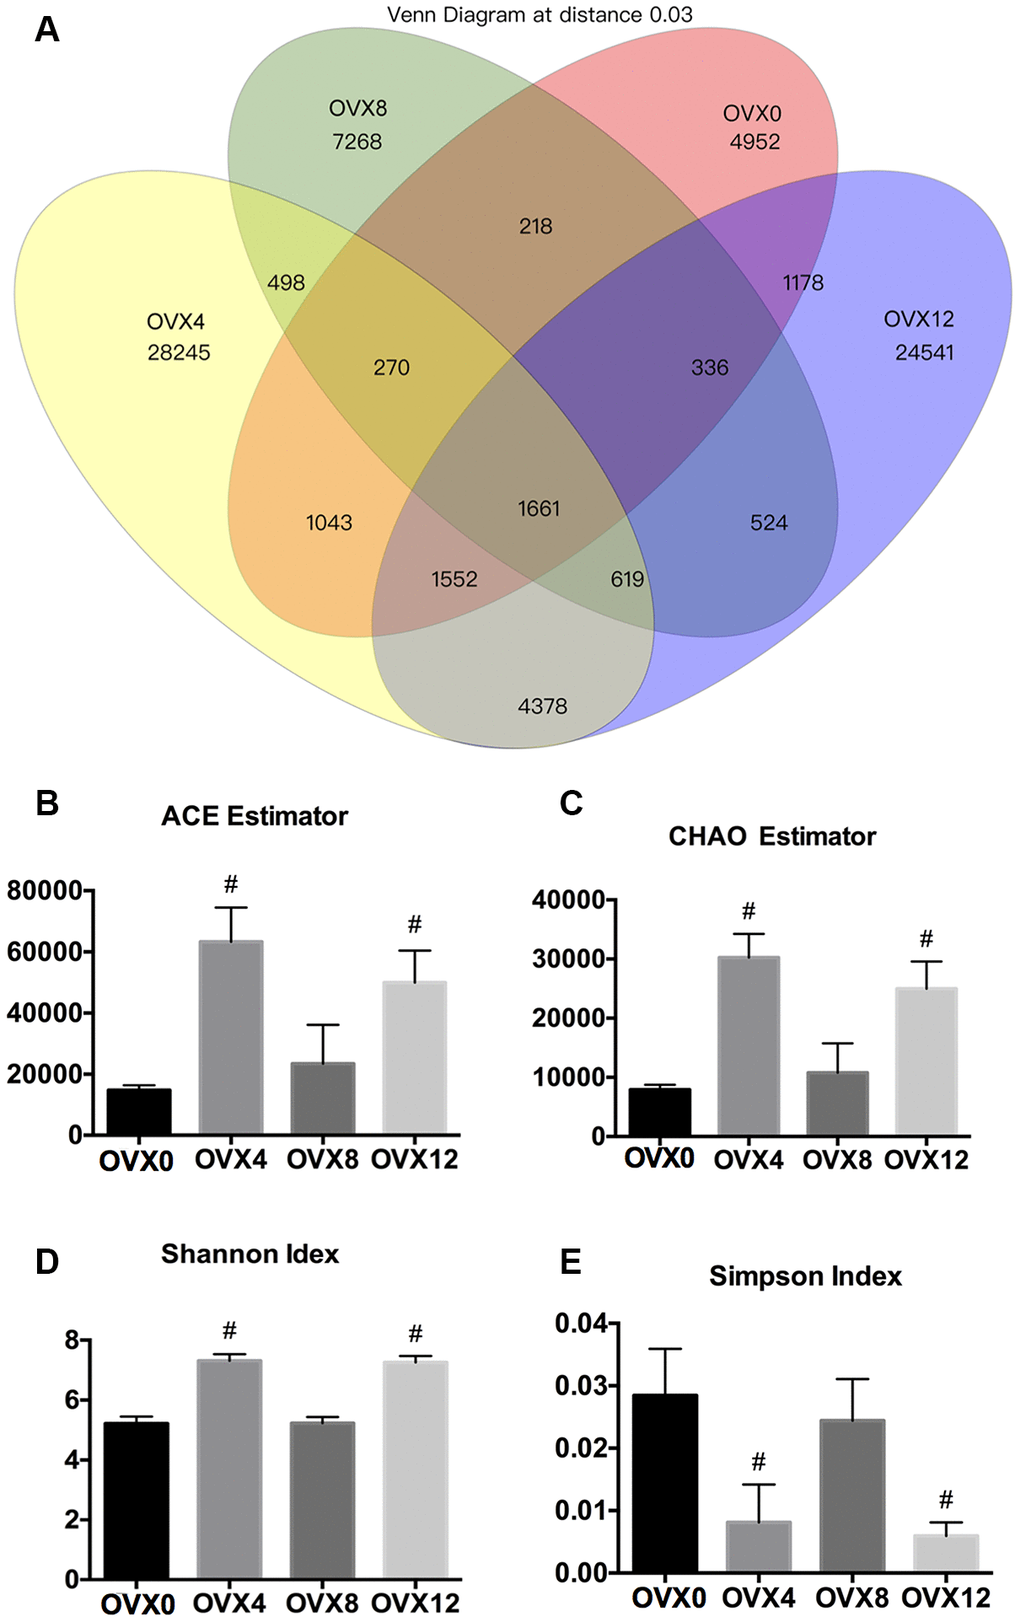
Figure 2.Venn diagram and alpha diversity assessment of samples following ovariectomy. Number of common and specific OTUs of samples with OTU=0.03 (A). Community richness assessment including the ACE estimator (B) and the Chao estimator (C); community diversity assessment including the Shannon index (D) and the Simpson index (E). Values were calculated using one-way ANOVA, #p < 0.01.