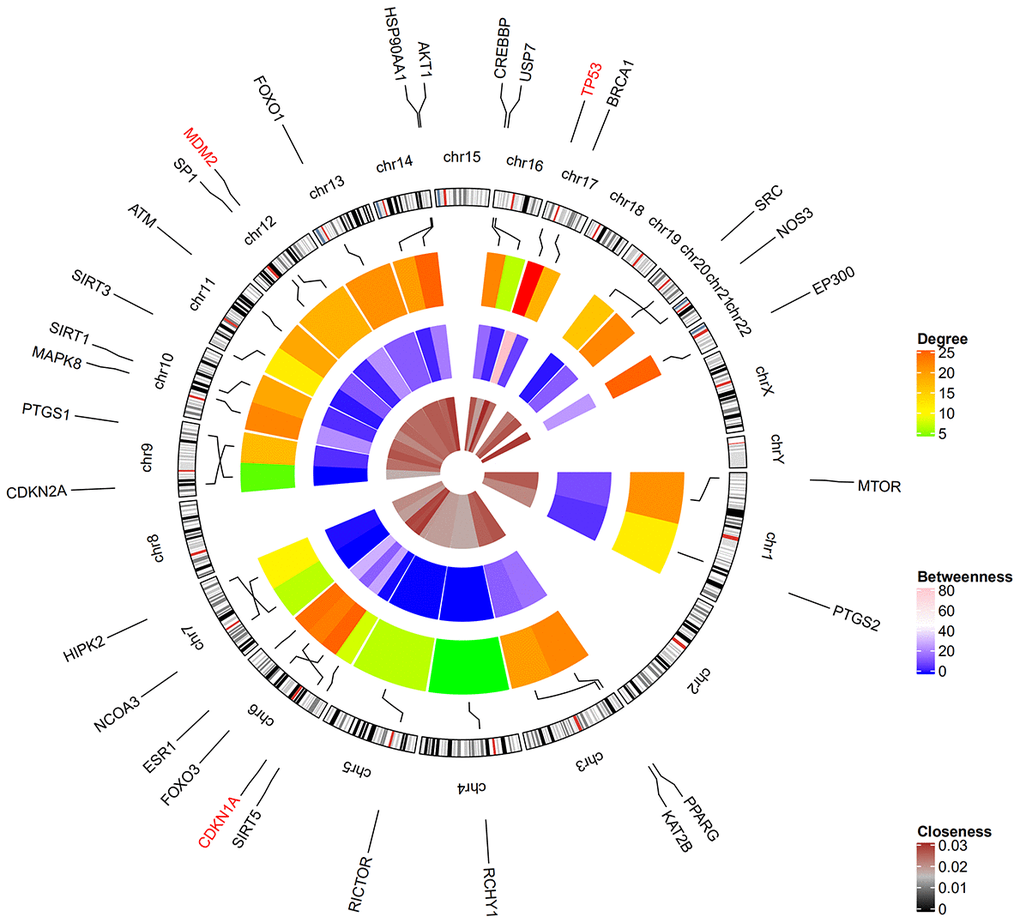
Figure 4.Circular visualization of chromosomal positions and connectivity of resveratrol-target genes. Gene names are shown in the outer circle. Different colors represent different degree, betweenness, and closeness values. The outer circle represents chromosomes; lines connect each gene to its chromosomal location. The three hub genes TP53, CDKN1A, and MDM2 highlighted in red are located in chr17, chr6, and chr12, respectively.