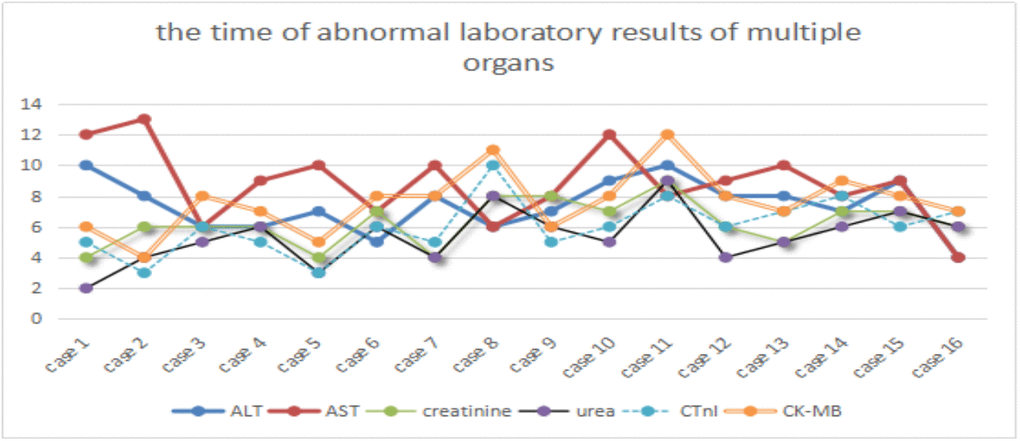
Figure 1.Time of abnormal laboratory results of multiple organs. ALT and AST, urea and creatinine, CTnI and CK-MB represent acute liver, renal and heart dysfunctions, respectively. X-axis represents the case number, whereas Y-axis denotes the time of abnormal laboratory results.