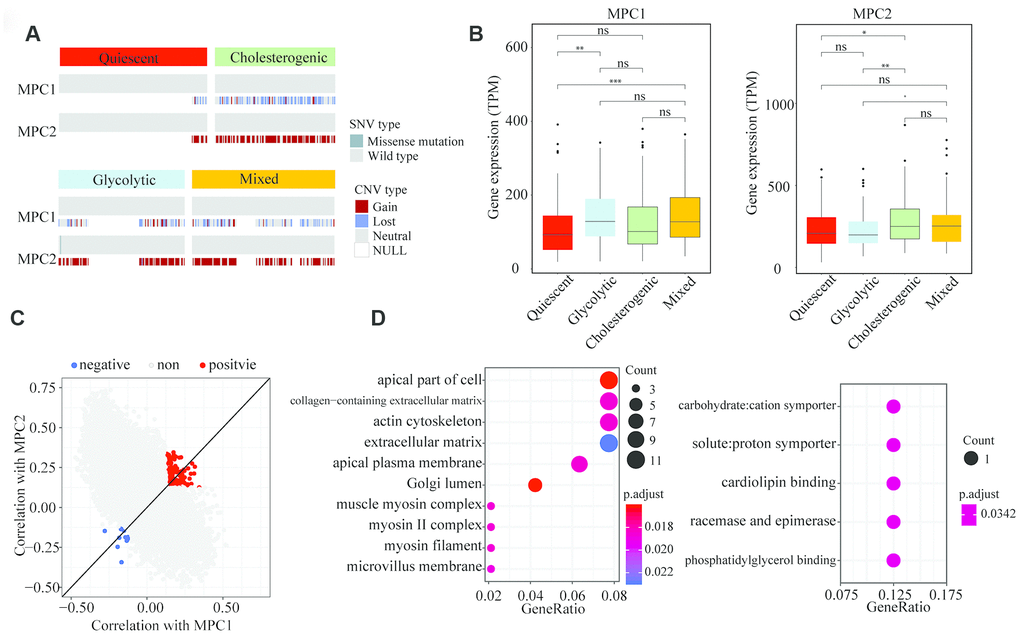
Figure 4.Association of MPC1 and MPC2 expression with LIHC metabolic subgroups and cell signaling pathways. (A) Oncoprint indicating the distribution of MPC1 and MPC2 SNVs and CNVs across the metabolic groups. Only one case was found with an SNV in MPC2. (B) Box plots of significant (p < 0.001) differences in MPC1 and MPC2 levels across the LIHC metabolic subgroups. (C) Scatter plot of the correlations of 25,483 genes with MPC1 (x-axis) and MPC2 (y-axis). In total, 168 genes correlated positively (Spearman correlation BH-adjusted p < 0.01) with both MPC1 and MPC2, while 14 genes correlated negatively with both MPC1 and MPC2 (adjusted p < 0.01). (D) The most significantly enriched (hypergeometric test BH-adjusted p < 0.05) gene sets among the genes positively (left) and negatively (right) associated with MPC1/2 expression.