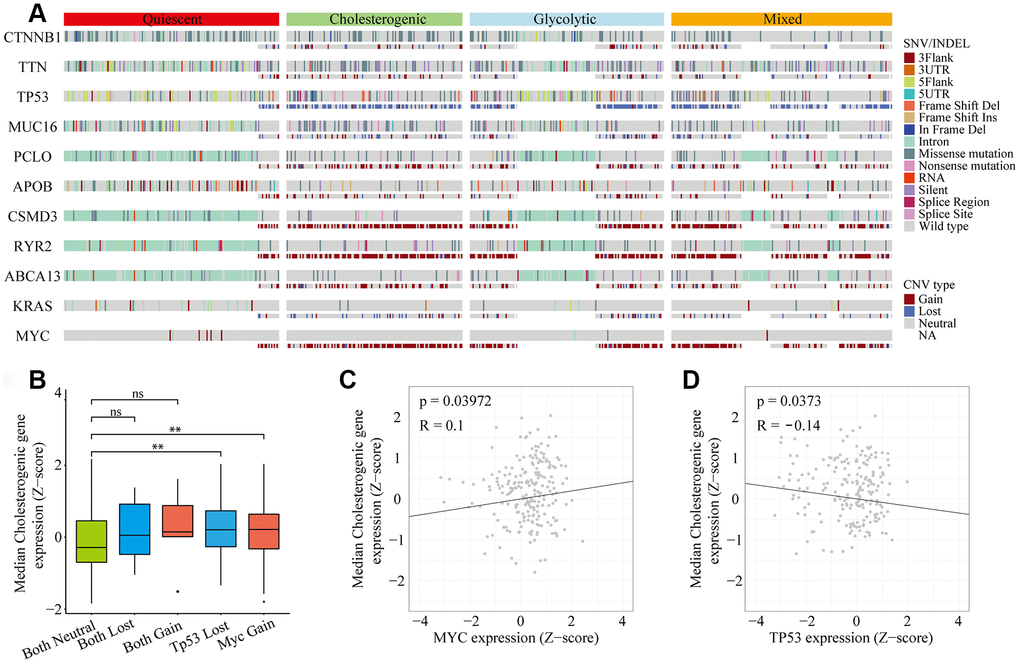
Figure 2.Gene mutational landscape across metabolic subgroups of HCC. (A) Oncoprint analysis indicating the distribution of SNVs, INDELs and CNVs of frequently mutated genes in LIHC across the metabolic subtypes. (B) Box plot of the median expression of cholesterogenic genes in samples with CNVs in TP53 and/or MYC. (C) Scatter plot of the correlation between the median cholesterogenic gene expression and MYC expression. (D) Scatter plot of the relationship between the median cholesterogenic gene expression and TP53 expression.