Submit an Article
Navigate
Home
Editorial Board
Editorial Policies
Current Volume
Archive
Scientific Integrity
Publication Ethics Statements
Interviews with Outstanding Authors
Newsroom
Sponsored Conferences
Podcast
Contact
Special Collections
Submit an Article
Online ISSN: 1945-4589
Research Paper
|
Volume 12, Issue 8
|
pp. 7585–7602
PTX3 modulates the immunoflogosis in tumor microenvironment and is a prognostic factor for patients with clear cell renal cell carcinoma
Back to article
Figure 3
(3 of 6)
−
100%
+
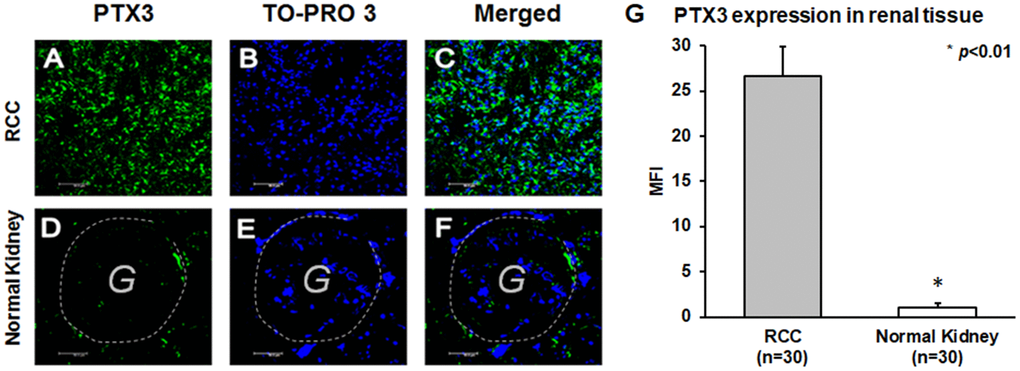
Figure 3.
PTX3 expression in neoplastic (
A
-
C
) and normal renal tissues (
D
-
F
) by confocal microscopy and quantification of specific fluorescence (
G
).