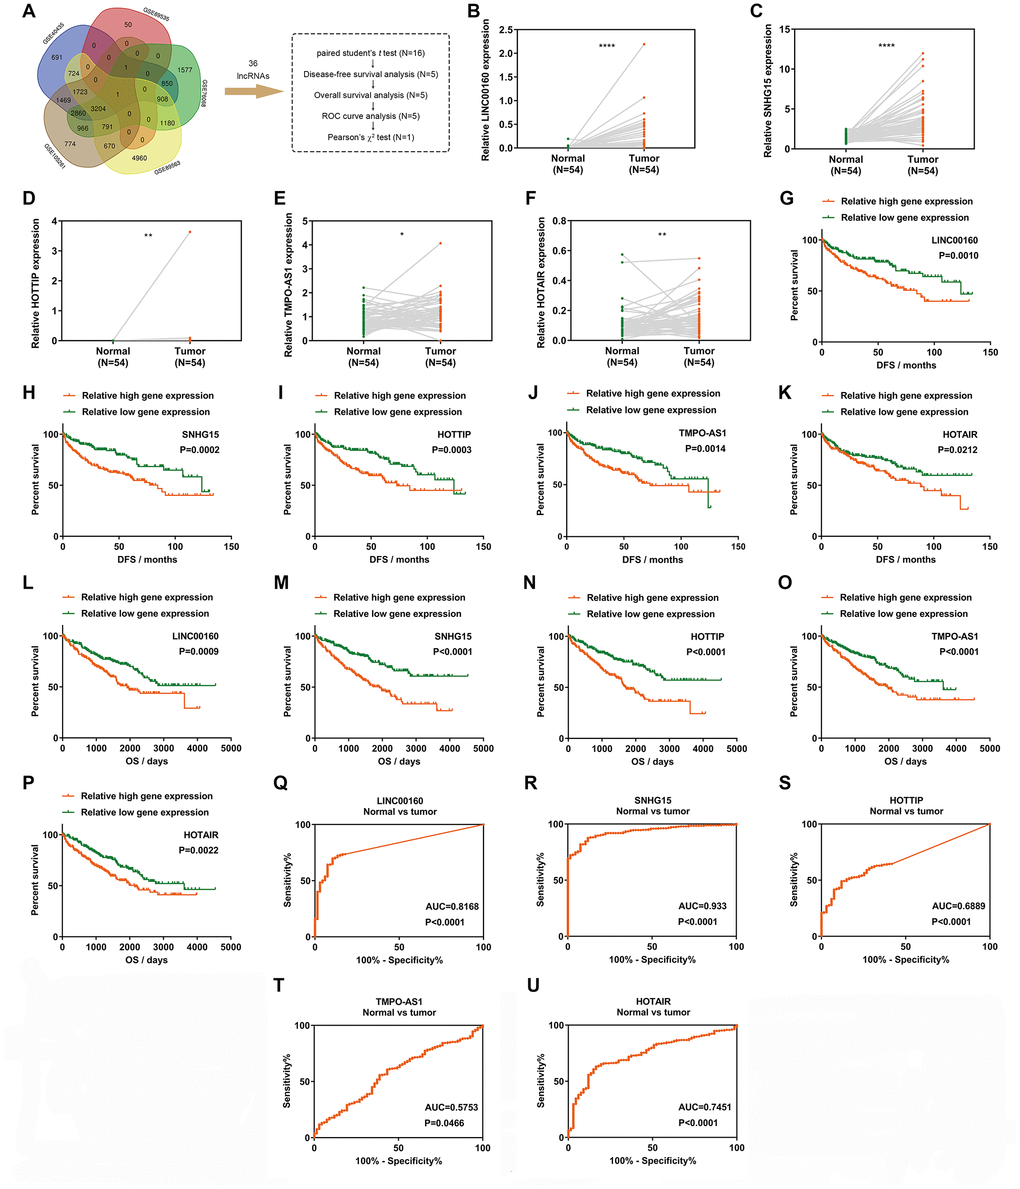
Figure 1.LINC00160 exhibits a diagnostic and prognostic value in renal cell carcinoma. (A) A Venn diagram of 5 independent gene sets (differentially expressed genes in RCC) from GEO datasets. (B–F) Relative gene expression comparison of LINC00160 (B), SNHG15 (C), HOTTIP (D), TMPO-AS1 (E) and HOTAIR (F) from 54 paired tissues in the TCGA-KIRC database. (G–K) DFS of RCC patients was associated with LINC00160 (G), SNHG15 (H), HOTTIP (I), TMPO-AS1 (J) and HOTAIR (K) expression. (L–P) OS of RCC patients was associated with LINC00160 (L), SNHG15 (M), HOTTIP (N), TMPO-AS1 (O) and HOTAIR (P) expression. (Q–U) ROC analysis was performed to differentiate kidney cancer patients from healthy individuals, according to LINC00160 (Q), SNHG15 (R), HOTTIP (S), TMPO-AS1 (T) and HOTAIR (U) expression. *P<0.05, **P<0.01, ***P<0.001 and ****P<0.0001. DFS, disease-free survival rate; OS, overall survival rate; ROC, receiver operating characteristic curve; RCC, renal cell carcinoma.