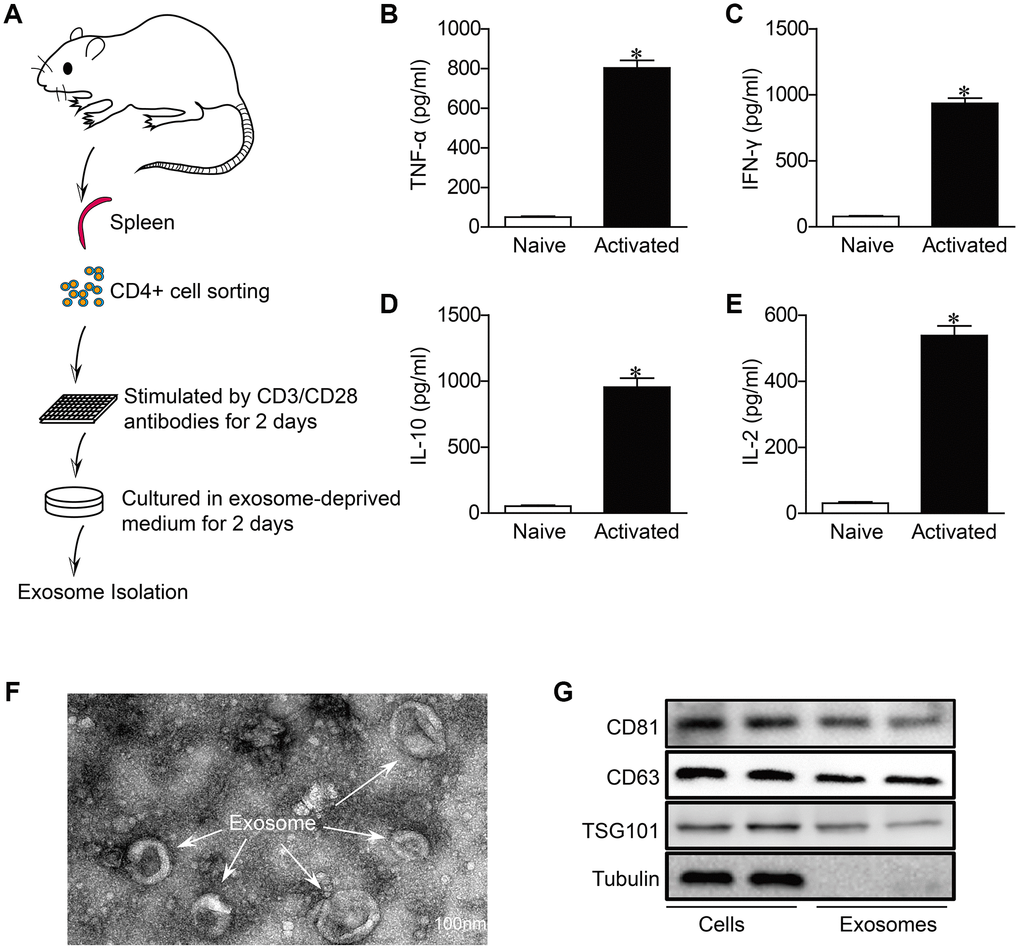
Figure 1.Characterization of activated CD4+ T cells-derived exosomes. (A) Schematic diagram for the isolation procedure of activated CD4+ T cells-derived exosomes. (B–E) ELISA analysis of IFN-γ,TNF-α, IL-2 and IL-10 in CD4+ T cells in response to anti-CD3 and anti-CD28 antibodies treatment for 48h (n = 5). *P < .05. (F) Transmission electron microscopic images of adult mouse CD4+ T cells-derived exosomes. Scale bar = 100 nm. The image shown is representative of three independent experiments. (G) Western blotting examination of exosome biomarkers in CD4+ T cells exosomes. The blots shown are representative of three independent experiments.