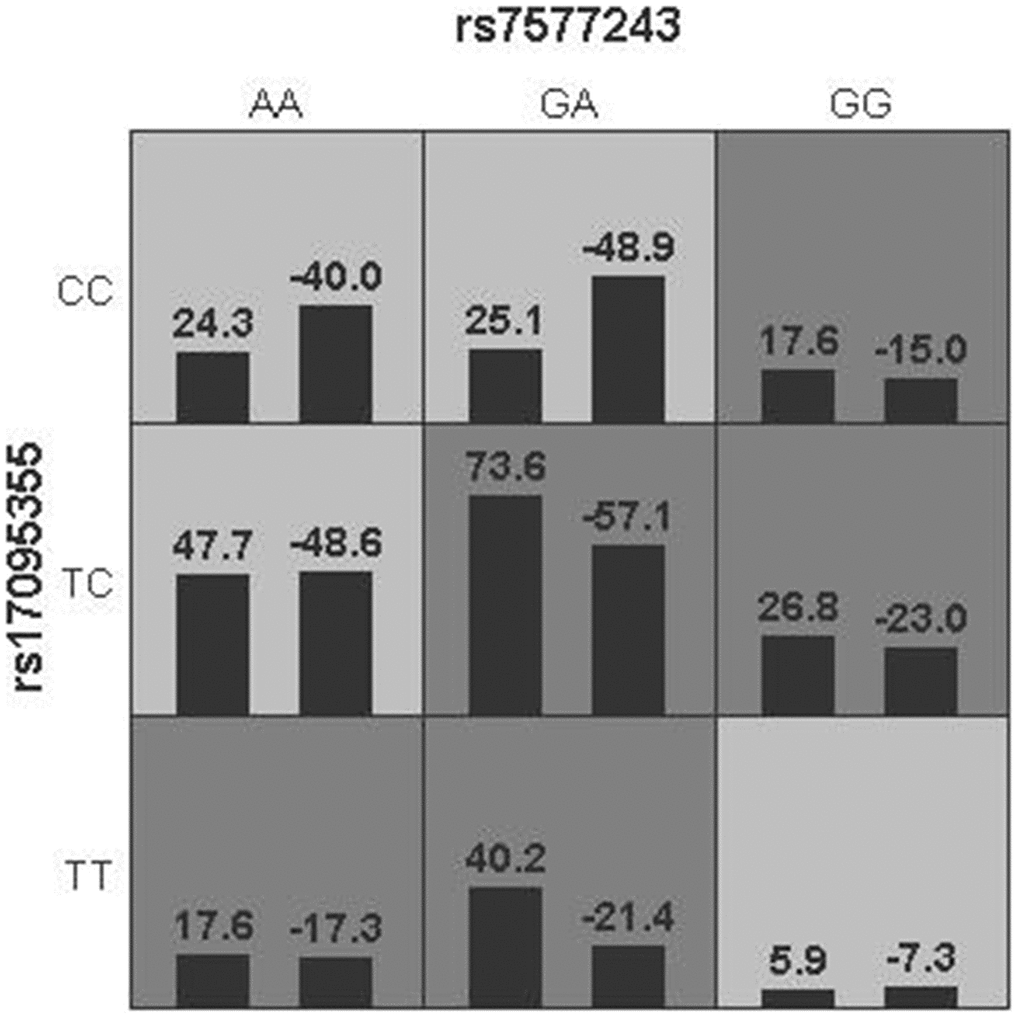
Figure 2.Gene-gene interaction networks derived from GMDR regarding BA risk. Multilocus genotype combinations of a two-factor model are associated with risk to BA best. In each cell, the left bar represents a positive score, and the right bar represents a negative score. High risk are represented by dark shading cells and low-risk cells by light shading. Rs17095355 was in ADD3 region and rs7577243 was in GPC1 region.