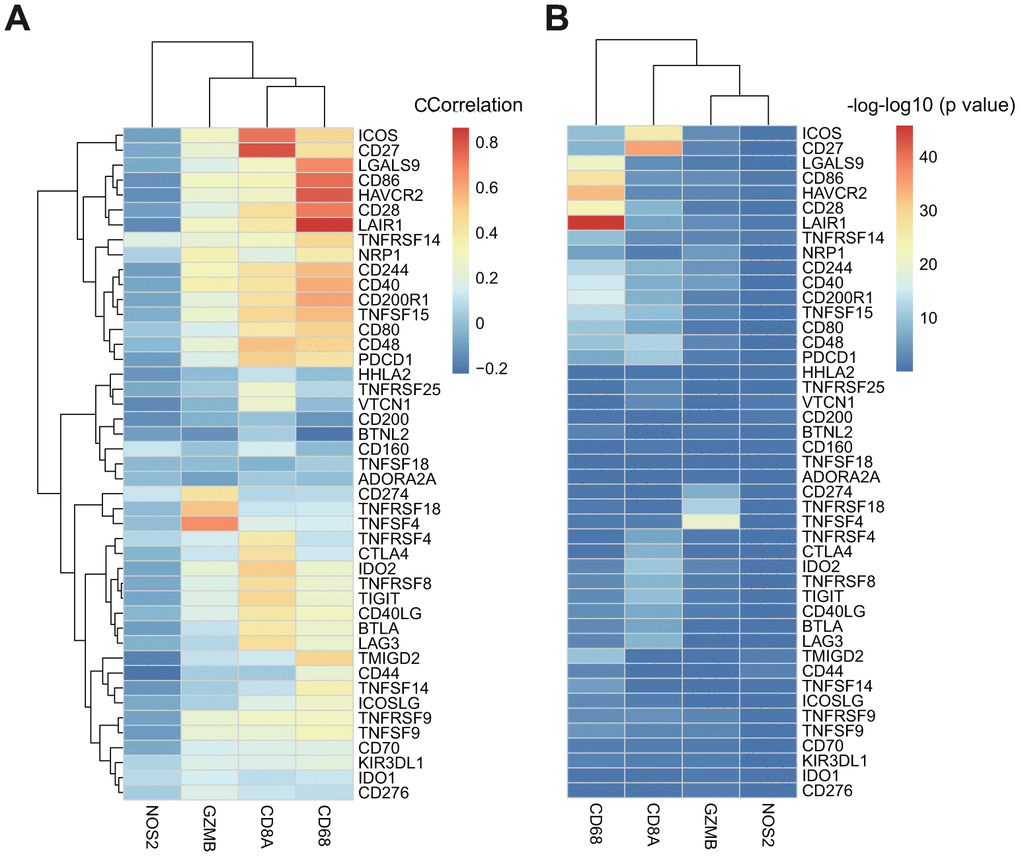
Figure 6.(A) The heatmap of correlation coefficient between ICGs and adaptive immune resistance pathway genes in TCGA-GBM. (B) The P-value of correlation coefficient Test between ICGs and adaptive immune resistance pathway genes in TCGA-GBM. P-value has been performed as a-log10 conversion.