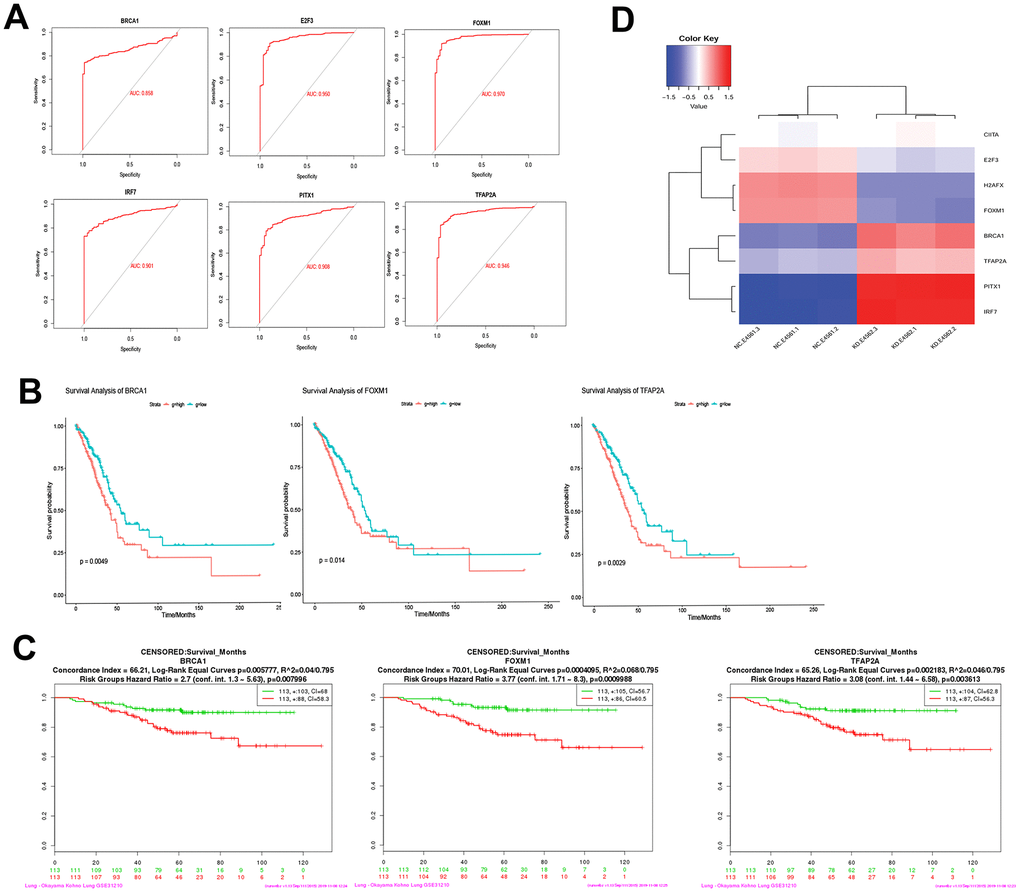
Figure 7.Diagnostic ability and survival curve analysis of transcription factors. (A) ROC curves of 6 genes prove that they have diagnostic ability for LUAD. (B) Survival curves of 3 genes most significantly correlated with LUAD. (C) The effect of 3 genes expression changes on prognosis was verified in GSE31210. (D) Transcription factors differential expression clustering thermogram, the differential expression of these eight pivot genes can be well distinguished USP22-KD H1975 cells and negative control.