Submit an Article
Navigate
Home
Editorial Board
Editorial Policies
Current Volume
Archive
Scientific Integrity
Publication Ethics Statements
Interviews with Outstanding Authors
Newsroom
Sponsored Conferences
Podcast
Contact
Special Collections
Submit an Article
Online ISSN: 1945-4589
Research Paper
|
Volume 12, Issue 8
|
pp. 6644–6666
LncRNA Sox2OT-V7 promotes doxorubicin-induced autophagy and chemoresistance in osteosarcoma via tumor-suppressive miR-142/miR-22
Back to article
Figure 10
(10 of 10)
−
100%
+
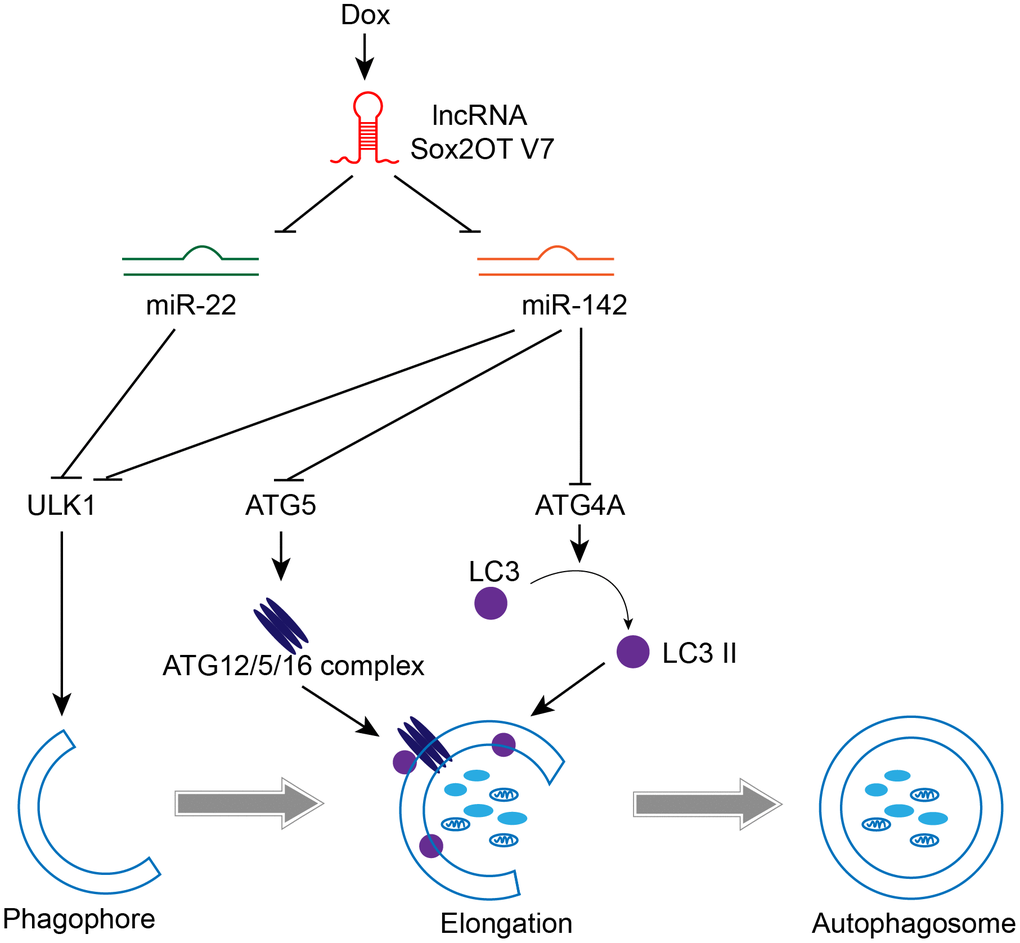
Figure 10.
A mechanistic schematic diagram showing the Sox2OT-V7/miR-142/miR-22 axis modulating the autophagy in OS cells via the autophagy-related genes, ULK1, ATG4A, and ATG5.