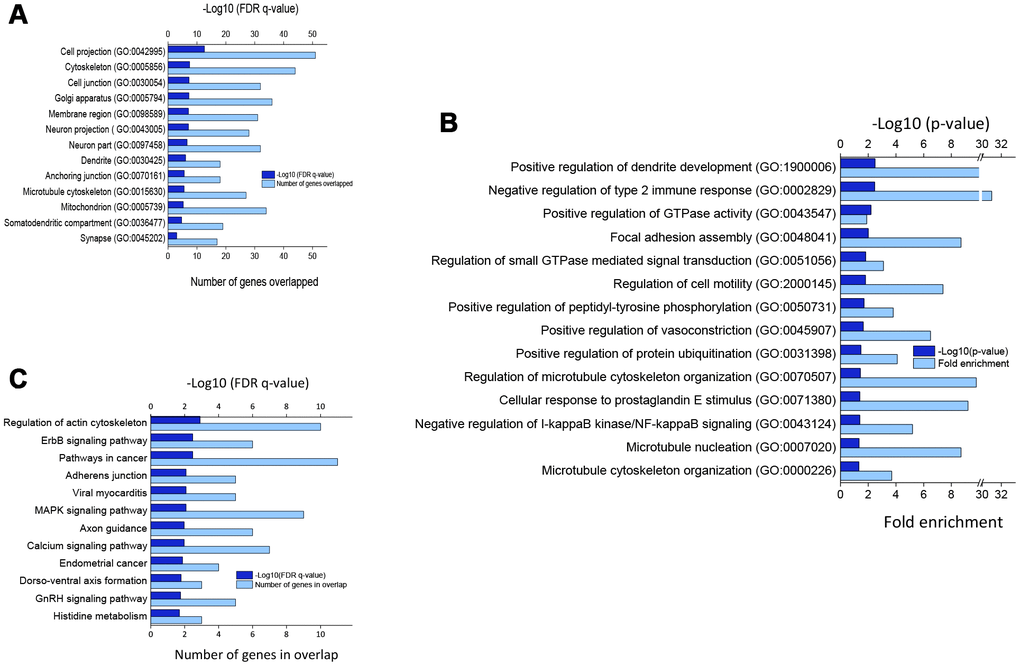
Figure 2.(A) Significantly enriched cellular components for DEGs. (B) Top biological processes as per p-value (modified Fisher’s exact) by DEGs. (C) Significantly enriched KEGG pathways by DEGs (p < 0.05; modified Fisher’s exact test). All the gene ontology enrichment analyses were performed using DAVID online tool.