Submit an Article
Navigate
Home
Editorial Board
Editorial Policies
Current Volume
Archive
Scientific Integrity
Publication Ethics Statements
Interviews with Outstanding Authors
Newsroom
Sponsored Conferences
Podcast
Contact
Special Collections
Submit an Article
Online ISSN: 1945-4589
Research Paper
|
Volume 12, Issue 6
|
pp. 5500–5515
The association of calcium intake with osteoporotic vertebral fractures in a large Chinese cohort
Back to article
Figure 2
(2 of 2)
−
100%
+
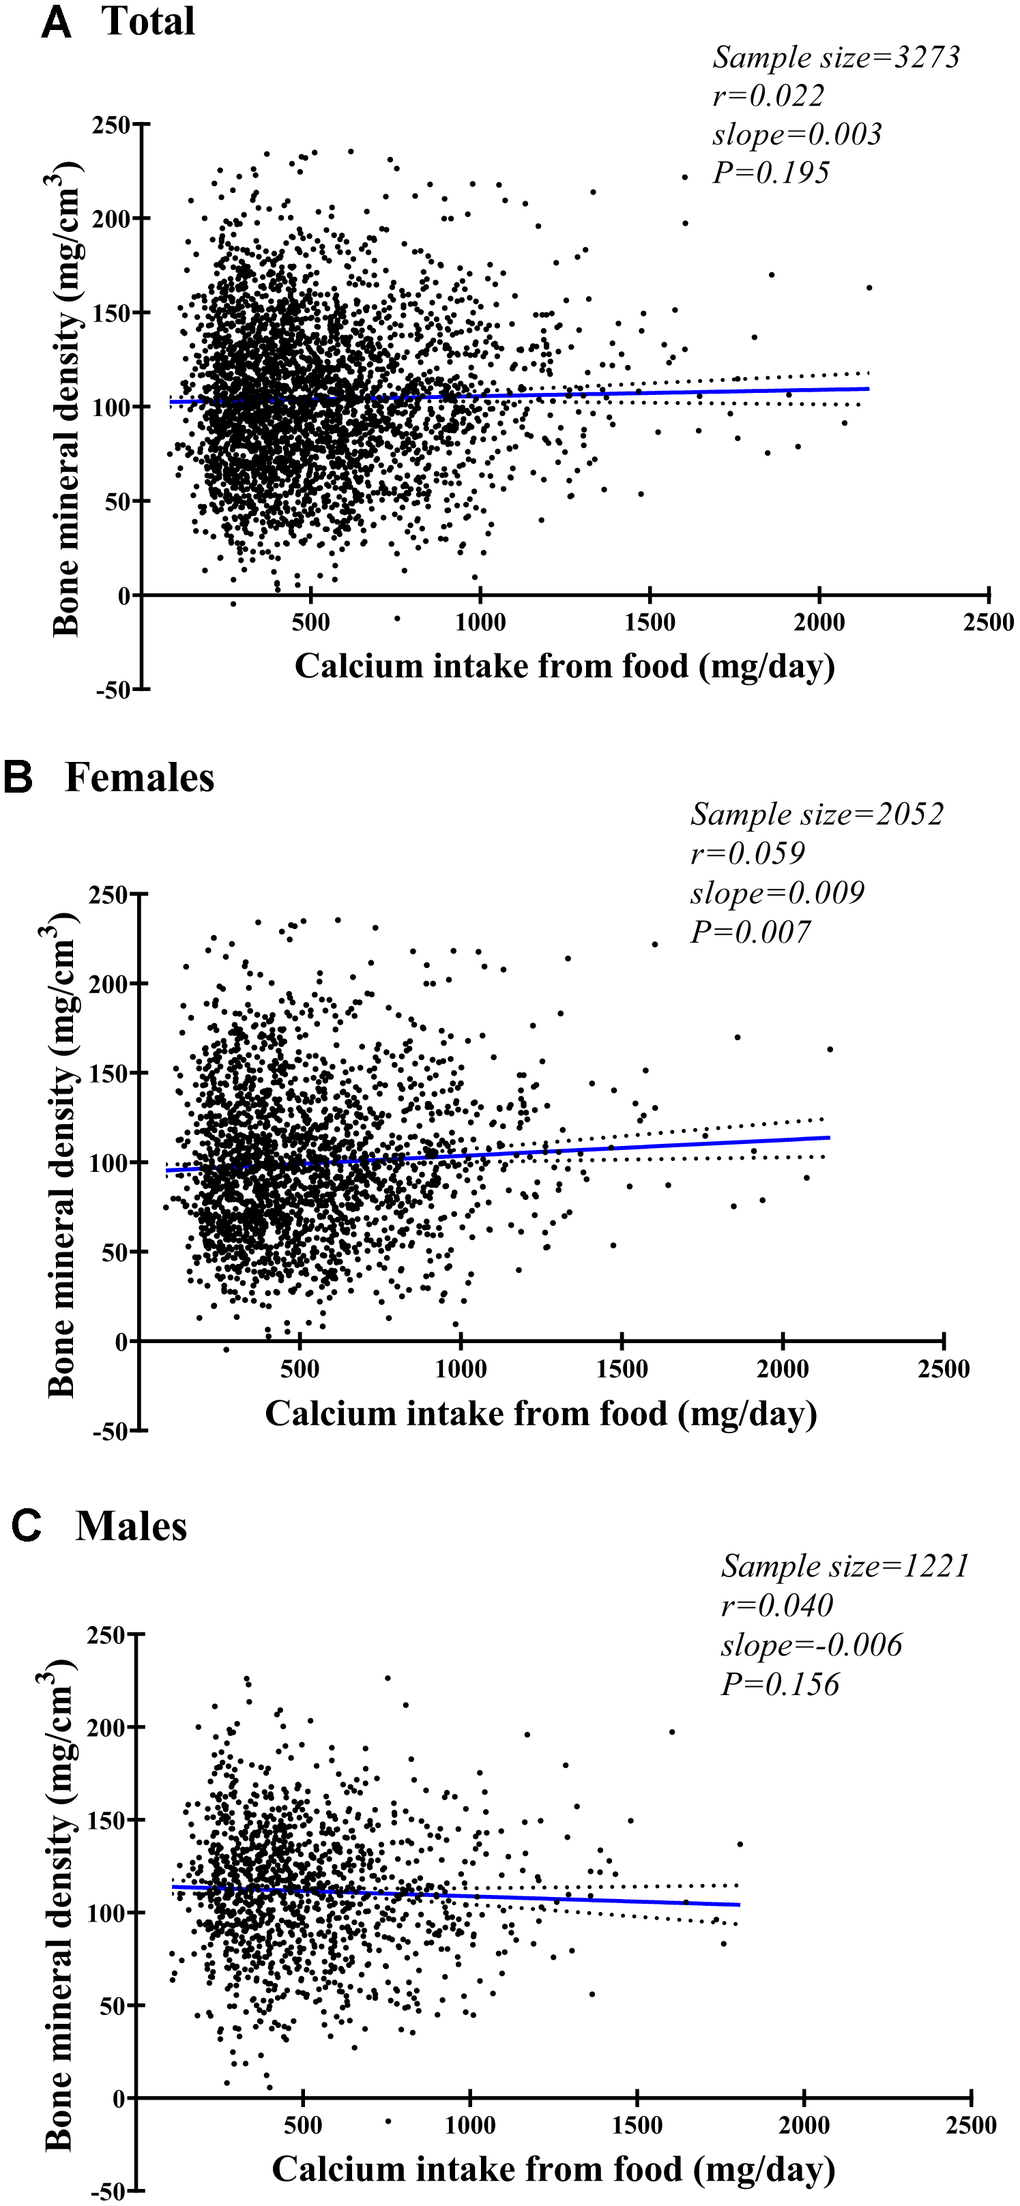
Figure 2.
Fitting plot for spinal bone mineral density and daily calcium intake from food among females (
A
), males (
B
), and both (
C
).