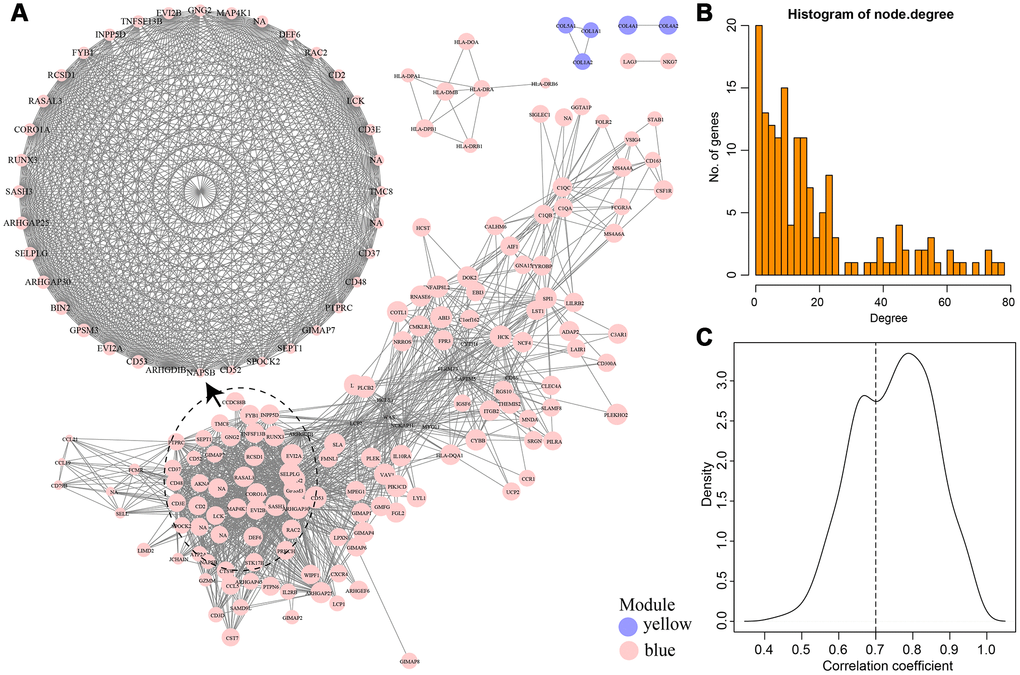
Figure 7.(A) Weight co-expression network of genes in Blue and Yellow modules. (B) The degree distribution of the network. (C) The correlation coefficient between genes and modules.
Figure 7 — Prognostic values of immune scores and immune microenvironment-related genes for hepatocellular carcinoma | Aging