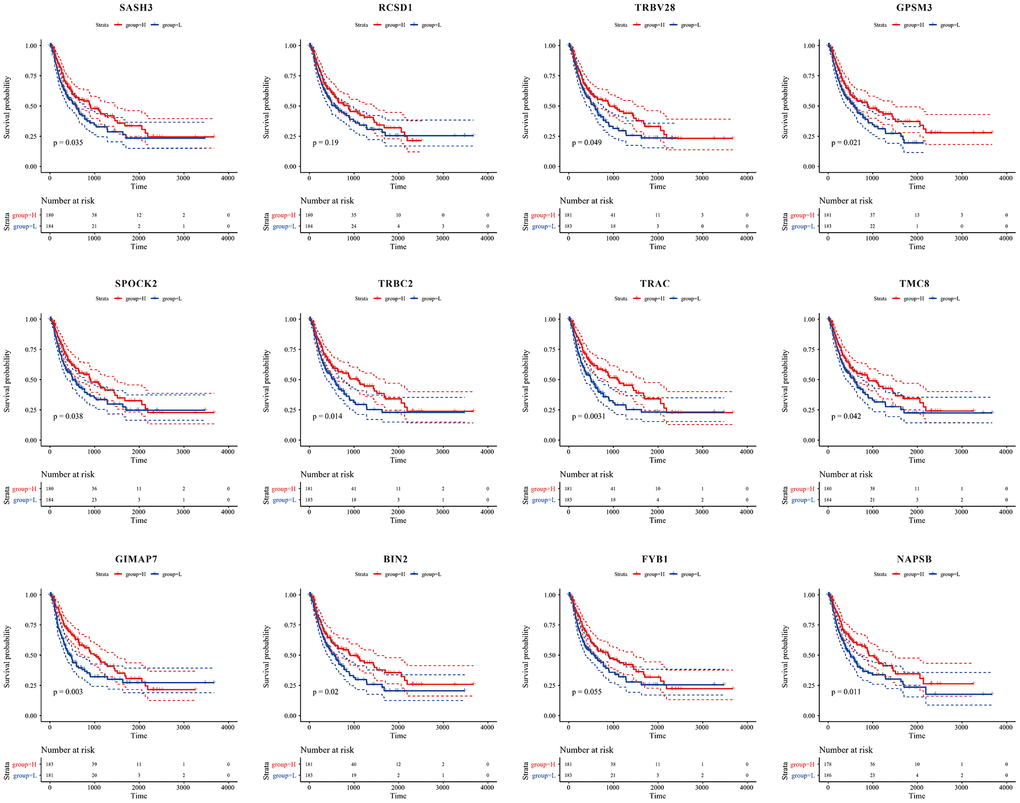
Figure 10.Kaplan-Meier curve for prognostic analysis of the 12 immune microenvironment genes. The red dotted line and blue dotted line respectively represented upper and lower limit of 95% confidence intervals of gene expression.
Figure 10 — Prognostic values of immune scores and immune microenvironment-related genes for hepatocellular carcinoma | Aging