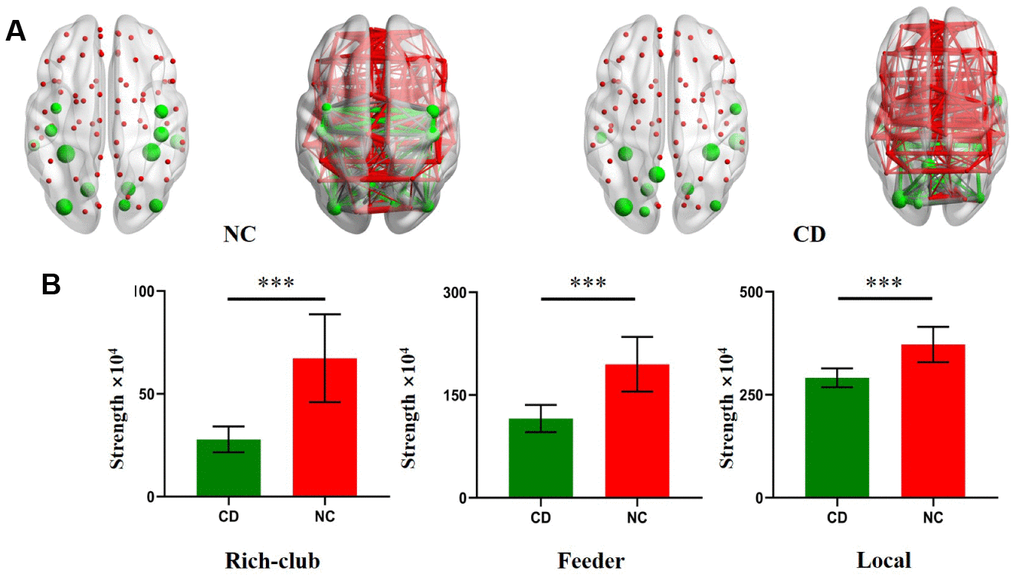
Figure 3.Rich Club regions distributions in CD patients and NC. (A) The hub nodes are shown with the node sizes indicating their nodal connection strength and rich club regions including the MTG.L, FFG.L, FFG.R, ITG.R, LING.L, LING.R, MOG.L, MOG.R, CUN.R, preCG.L, PreCG.R, PoCG.L, PoCG.R, SOG.L, PCUN.L, ITG.L, ROL.R. (B) The bar chart shows group differences in the rich-club, feeder, and local connection strengths. The bars and error bars represent the fitted values and the standard deviations, respectively.