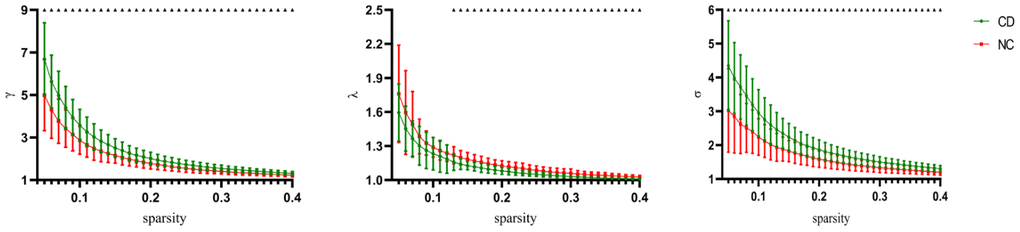
Figure 2.Change of small world organization network definition parameters as parameters as a function of sparsity. The error bars correspond to the standard error of the mean. Black triangle indicates points where the difference between the two groups is significant (P< 0.05, FDR corrected).