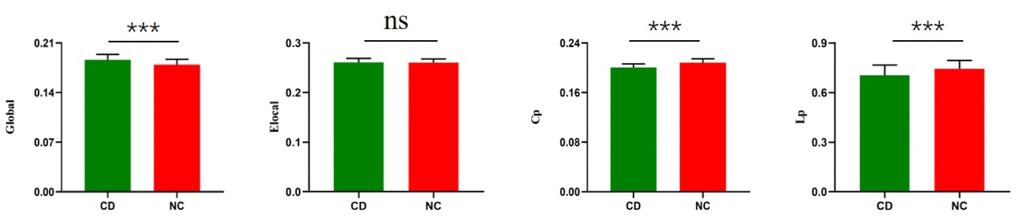
Figure 1.Group differences between CD patients and healthy controls in the global of functional brain networks. The bar and error bars represent the fitted values and standard deviations, respectively. Eglo= global efficiency, Eloc= local efficiency, Cp=cluster efficiency, Lp= shortest path length. CD= Cushing's disease, NC= healthy control.