Submit an Article
Navigate
Home
Editorial Board
Editorial Policies
Current Volume
Archive
Scientific Integrity
Publication Ethics Statements
Interviews with Outstanding Authors
Newsroom
Sponsored Conferences
Podcast
Contact
Special Collections
Submit an Article
Online ISSN: 1945-4589
Research Paper
|
Volume 12, Issue 6
|
pp. 5140–5151
Association between serum angiopoietin-2 concentrations and periprocedural myocardial injury in patients undergoing elective percutaneous coronary intervention
Back to article
Figure 1
(1 of 3)
−
100%
+
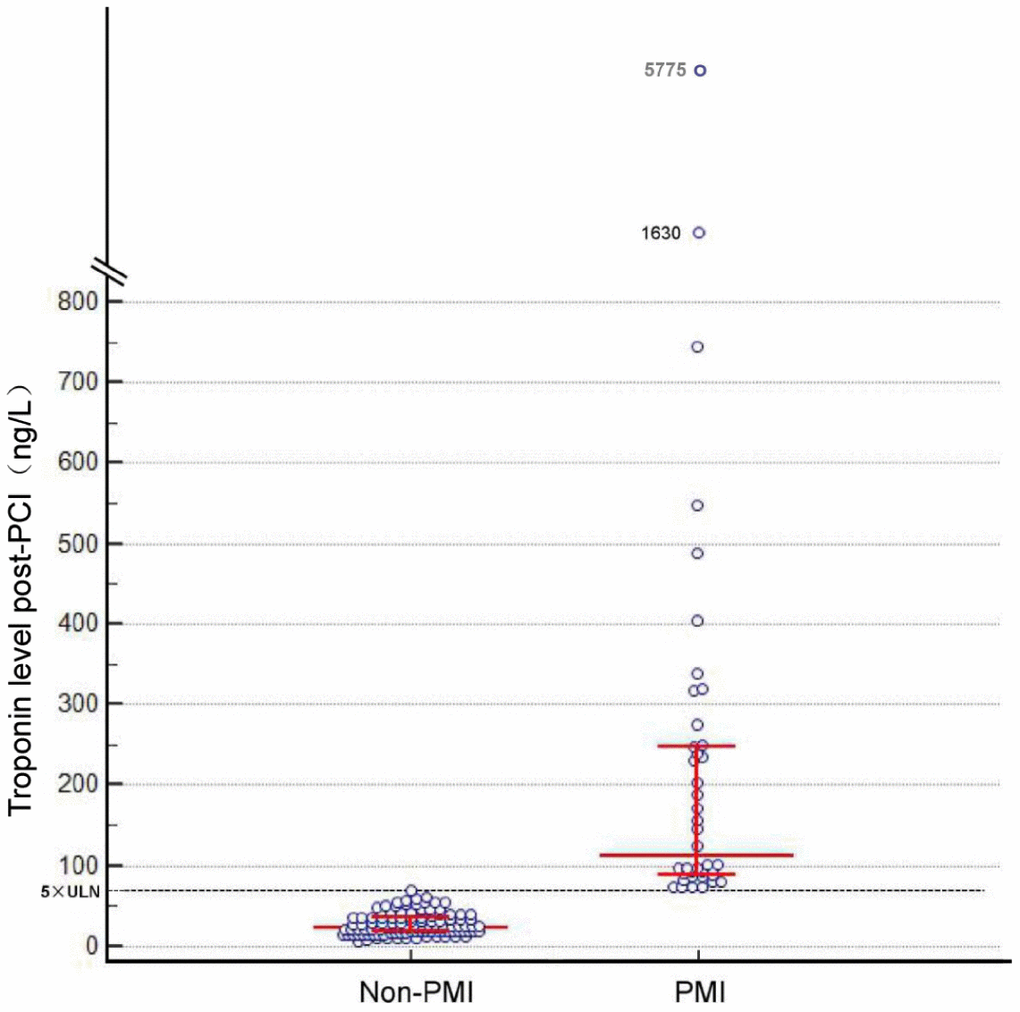
Figure 1.
Post-percutaneous coronary intervention troponin levels.
Bars indicate median levels with interquartile range. The dotted line indicates the limit of 70 ng/L. ULN, upper limit of the normal.