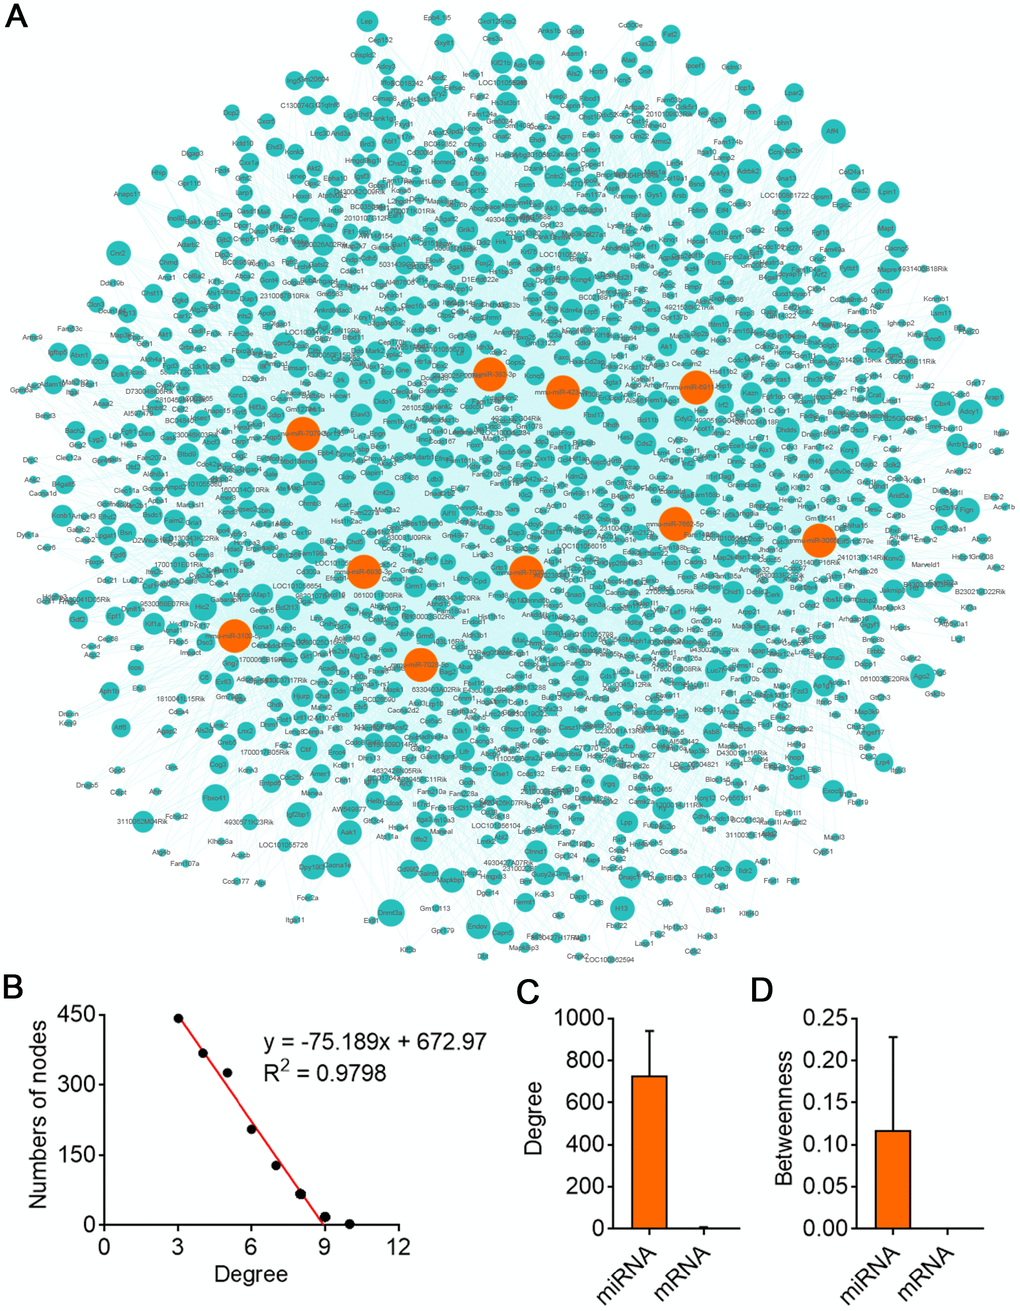
Figure 6.CircBBS9 target miRNA-mRNA network analysis. (A) Network of the circRNA-miRNA which have greater interaction score with their target mRNAs. The pink nodes represented miRNA and the green nodes represented mRNAs. (B) Degree distribution of circBBS9 related miRNA-mRNA network. (C, D) The degree and betweenness centrality of mRNAs and miRNAs.