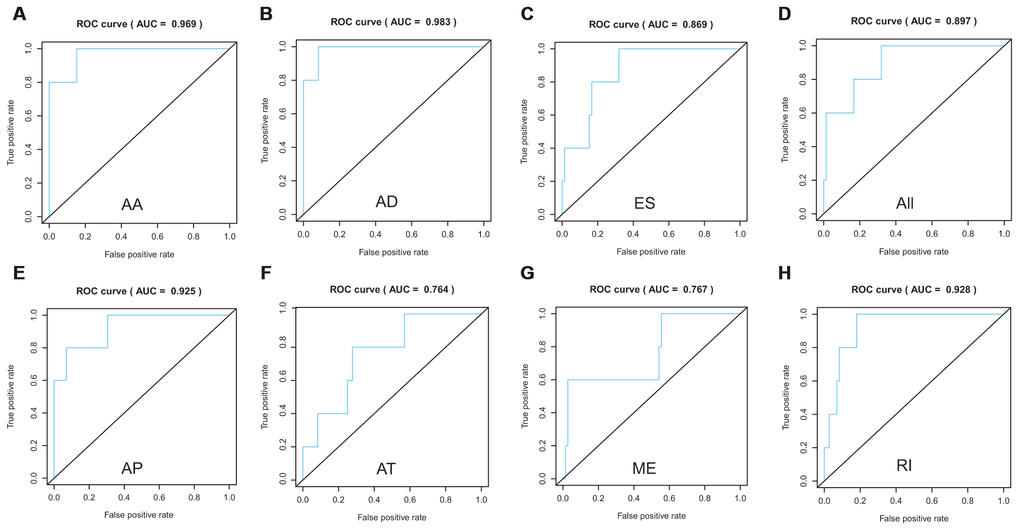
Figure 5.ROC curves to evaluate the predictive power of each prognostic signature. AA cohort (A), AD cohort (B), ES cohort (C), the whole cohort (D), AP cohort (E), AT cohort (F), ME cohort (G) and RI cohort (H).
Figure 5 — Identification of survival-associated alternative splicing events and signatures in adrenocortical carcinoma based on TCGA SpliceSeq data | Aging