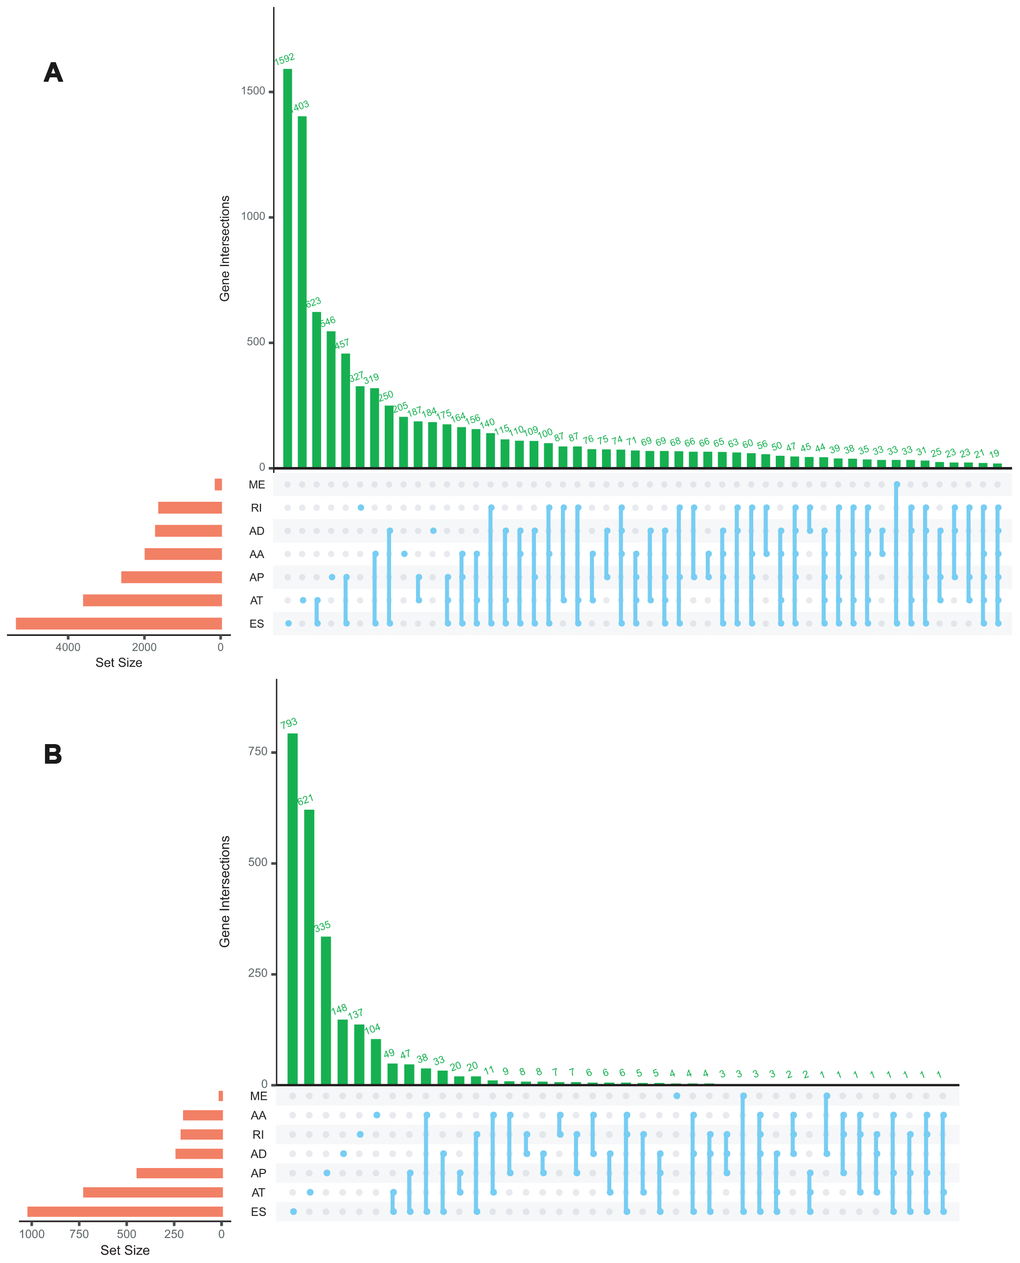
Figure 1.Upset plot of interactions among seven types of all AS events (A) and survival-associated AS events (B) in ACC.
Figure 1 — Identification of survival-associated alternative splicing events and signatures in adrenocortical carcinoma based on TCGA SpliceSeq data | Aging