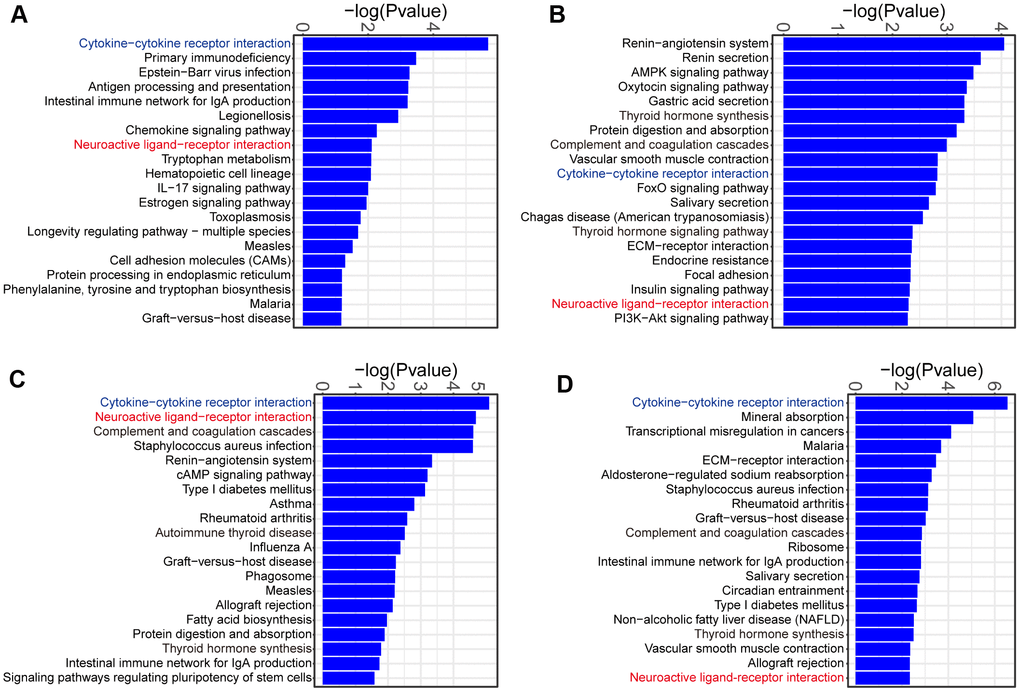
Figure 5.KEGG pathway analysis of the DEGs identified in comparison of MCT-treatment with control. (A) KEGG pathway terms enriched in DEGs at week 1, (B) KEGG pathway terms enriched in DEGs at week 2, (C) KEGG pathway terms enriched in DEGs at week 3 and (D) KEGG pathway terms enriched in DEGs at week 4. Only the top 20 KEGG pathway terms were showed.