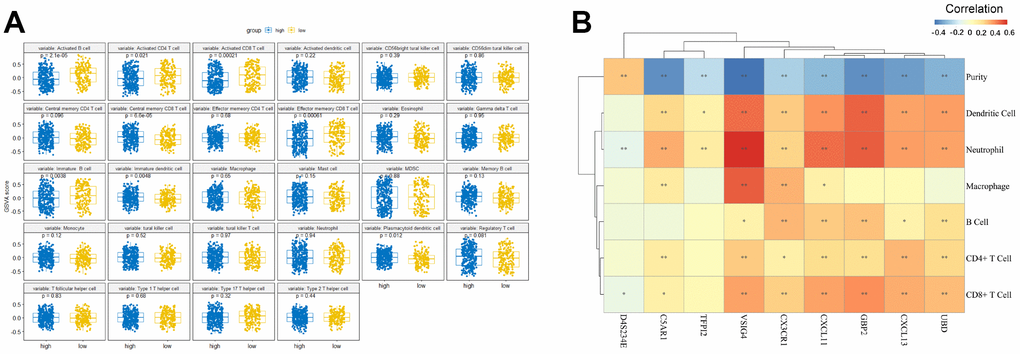
Figure 6.The relationship between the nine-gene signature and immune infiltration. (A) Comparison of relative immune cell abundance based on GSVA score in high-risk and low-risk groups (B) Partial Spearman's correlation of nine genes expression and immune infiltrates. *: Statistically significant p < 0.05, **: Statistically significant p < 0.01.