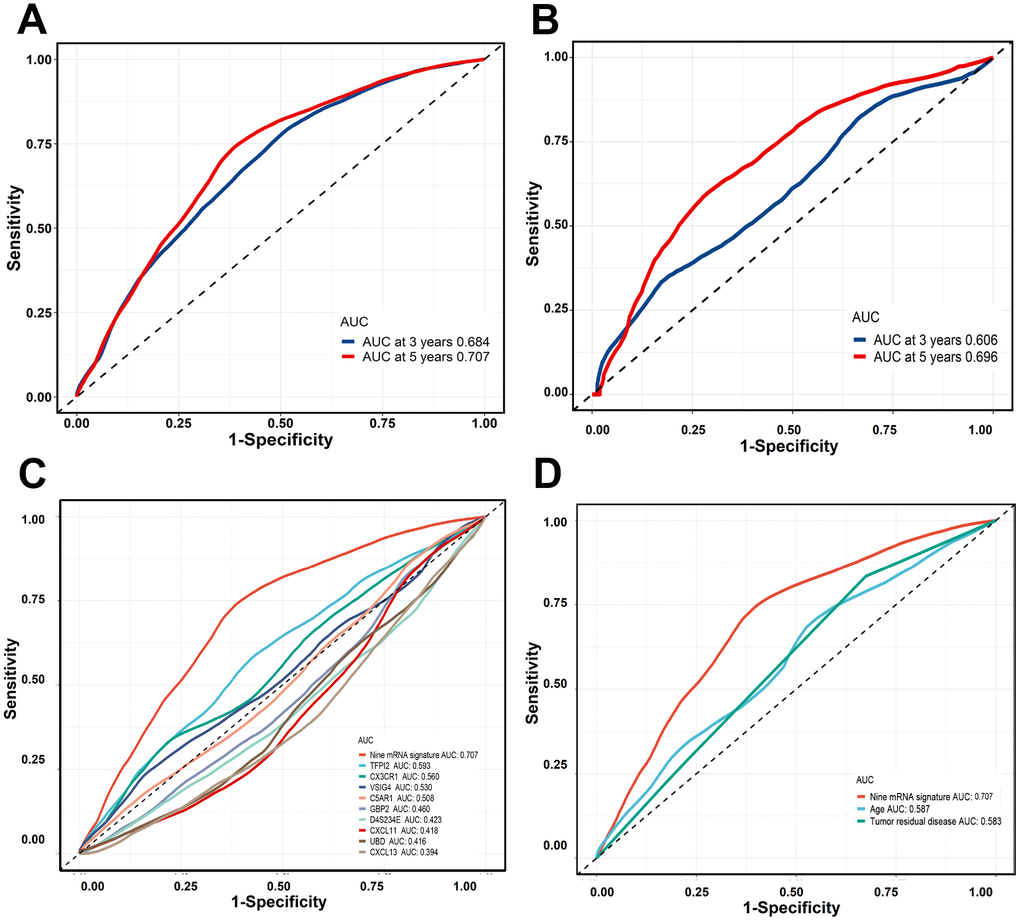
Figure 5.Time-dependent ROC curves were generated to evaluate the nine-gene signature performance. (A, B) Three-years or five-years ROC curves of the nine-gene signature in the training cohort and validation cohort. © Five-years ROC curves for nine-gene signature and single gene. (D) Five-years ROC curves for nine-gene signature and clinical risk factor.