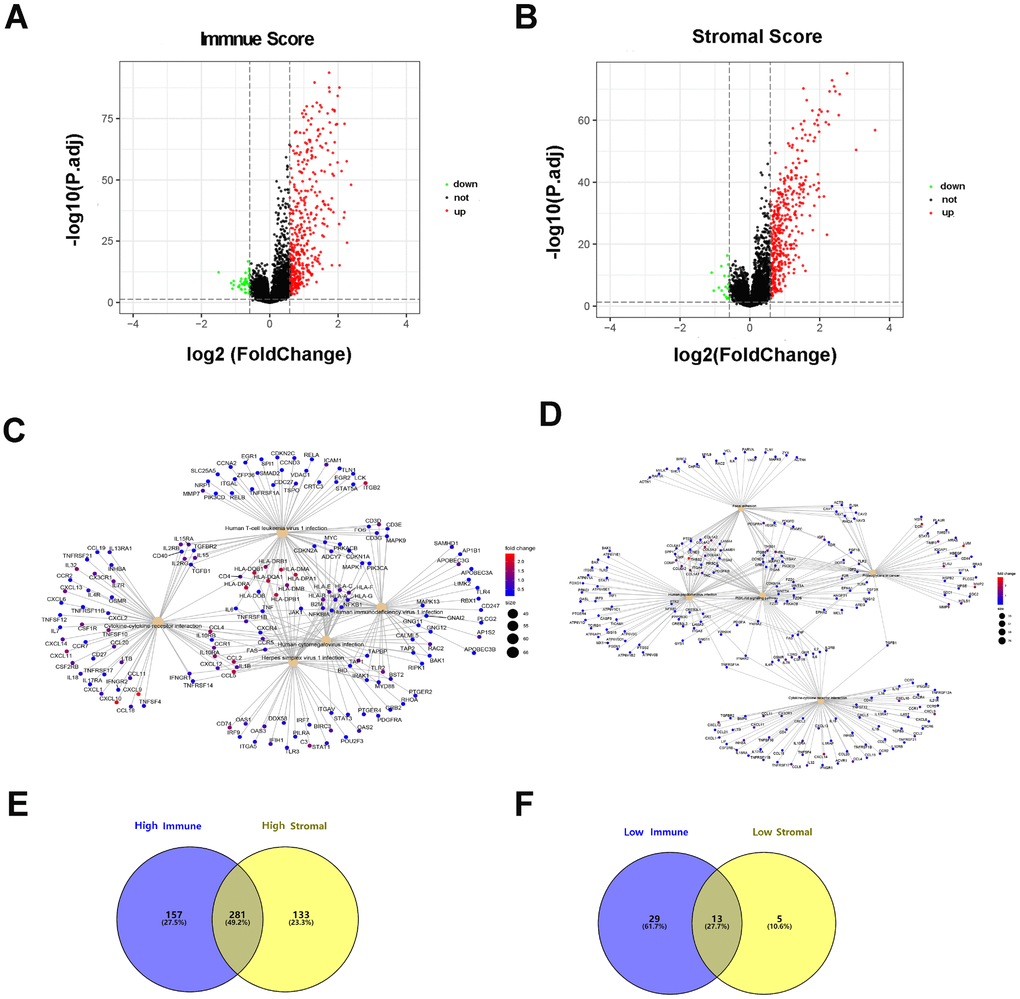
Figure 2.Differentially expressed genes based on immune scores and stromal scores. (A) The volcano plot showed that 438 genes were up-regulated and 42 genes down-regulated in the high immune scores group compared with the low scores group. (B) In a similar way, 414 upregulated genes and 18 downregulated genes were identified by comparing stromal scores. (C, D) Significantly enriched gene sets of the immune or stromal score group. (E, F) A total of 281 DEGs were in common among the high immune/stromal score groups and 13 DEGs in low immune/stromal score groups.