Submit an Article
Navigate
Home
Editorial Board
Editorial Policies
Current Volume
Archive
Scientific Integrity
Publication Ethics Statements
Interviews with Outstanding Authors
Newsroom
Sponsored Conferences
Podcast
Contact
Special Collections
Submit an Article
Online ISSN: 1945-4589
Research Paper
|
Volume 12, Issue 6
|
pp. 4866–4878
MiR-519d targets HER3 and can be used as a potential serum biomarker for non-small cell lung cancer
Back to article
Figure 3
(3 of 8)
−
100%
+
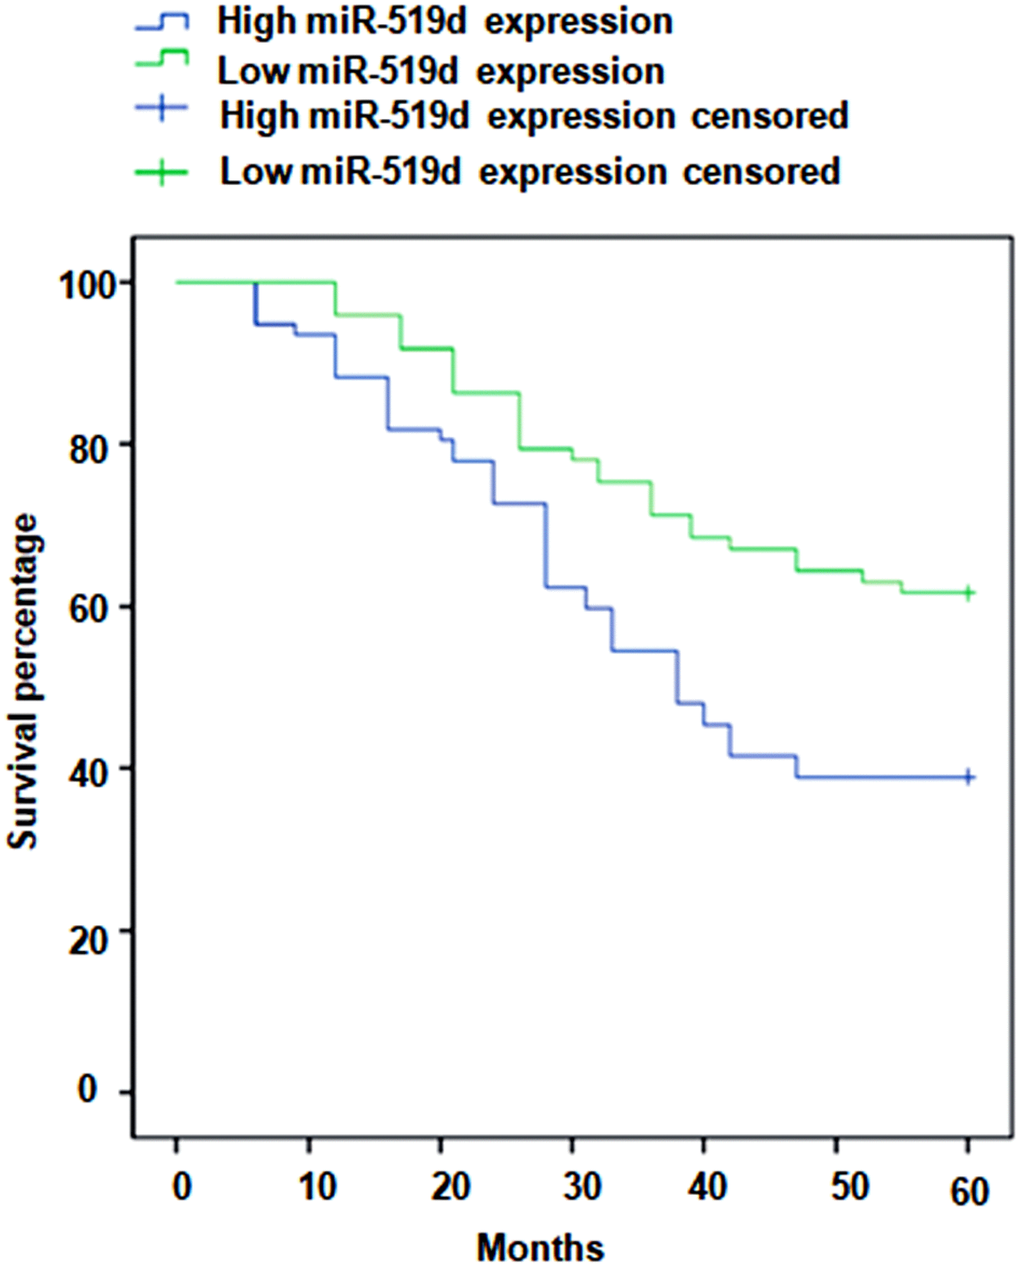
Figure 3.
Kaplan-Meier curves stratified according to serum miR-519d levels.
Figure 3 — MiR-519d targets HER3 and can be used as a potential serum biomarker for non-small cell lung cancer | Aging