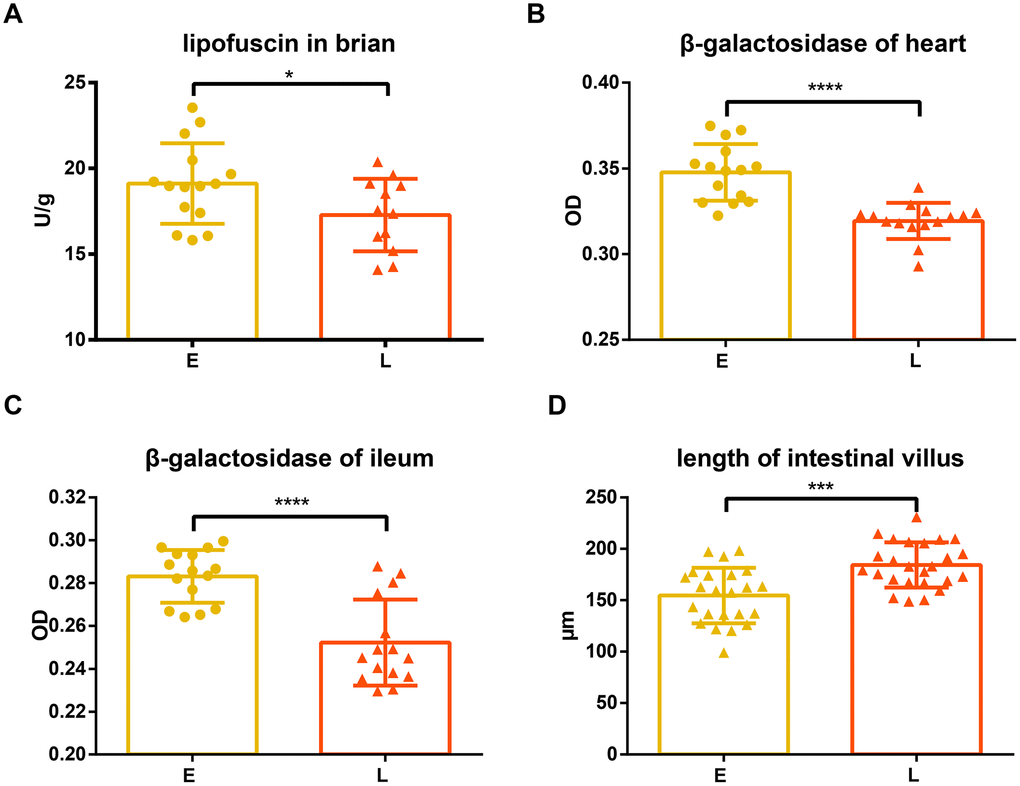
Figure 2.Difference in aging related indices between groups E and L. (A) and (D) Lipofuscin in brain and length of intestinal villus are shown on. The level of β-gal in both the (B) heart and (C) ileum in E group and L group. *p<0.05, unpaired t test, ***p<0.0001, ****p<0.001, Mann-Whitney U test.