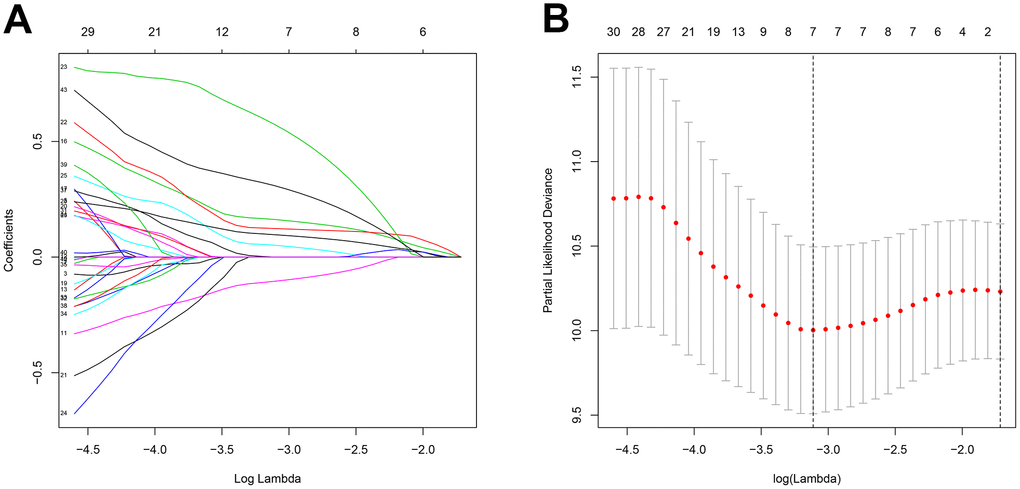
Figure 2.Feature selection using the Lasso regression model. (A) Lasso regression analysis coefficients. (B) Selection of tuning parameters in the Lasso regression analysis based on 1,000 cross-validations.
Figure 2 — Risk score based on expression of five novel genes predicts survival in soft tissue sarcoma | Aging