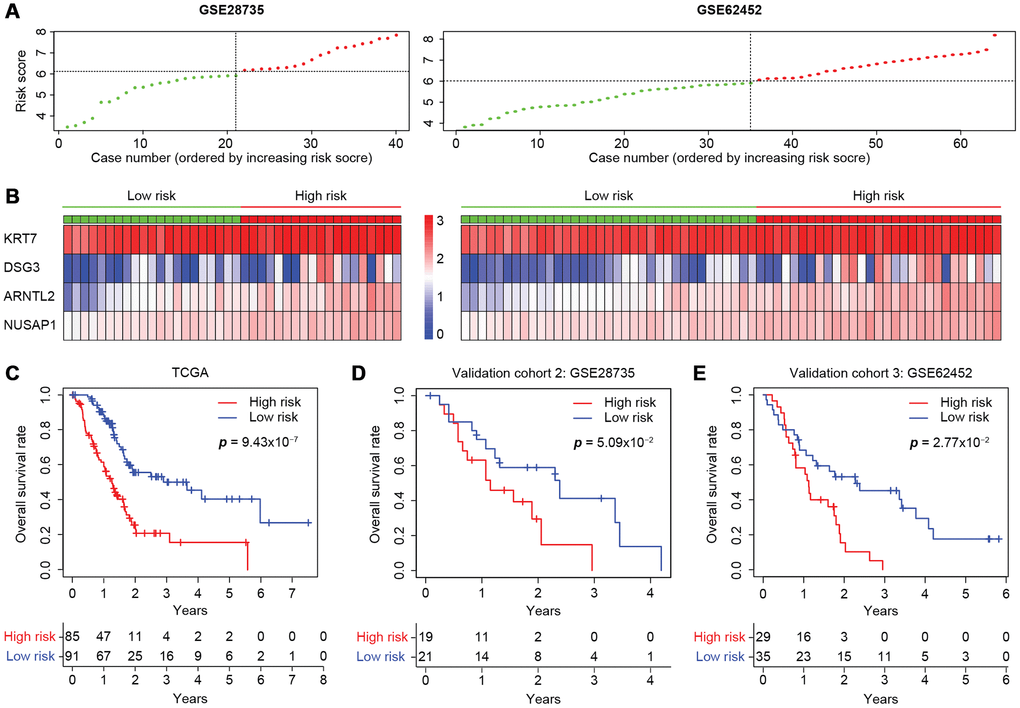
Figure 7.Validation of the four-gene model in two independent microarray datasets. (A) The risk score distribution in the GSE28735 and GSE62452 cohorts. (B) Heatmap displaying the levels of the four genes in the high- and low-risk groups. The color of each case corresponds to the log2FC of the gene level, as shown in the key. (C–E) Kaplan-Meier survival plots of high- or low-risk patients in the cohorts from TCGA (C), GSE28735 (D) and GSE62452 (E). The number of patients remaining at a particular timepoint is shown at the bottom.