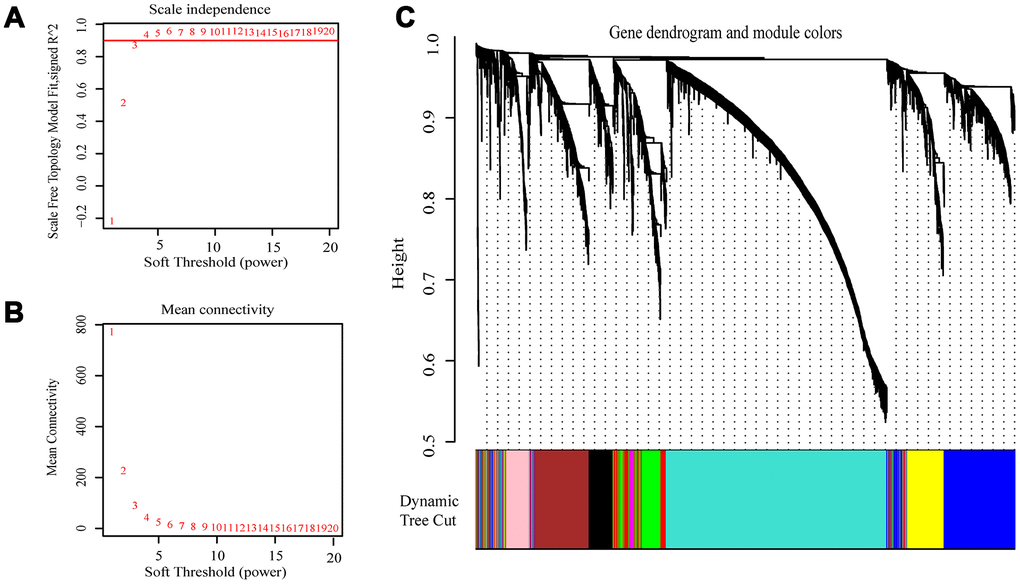
Figure 2.Selection of the appropriate beta value to construct a hierarchical cluster number. (A) Analyze the scale-free fit index of the 1-20 soft threshold power (β). (B) Analyze the average connectivity of 1-20 soft threshold power. (C) Genes are grouped into various modules by hierarchical clustering, and different colors represent different modules.