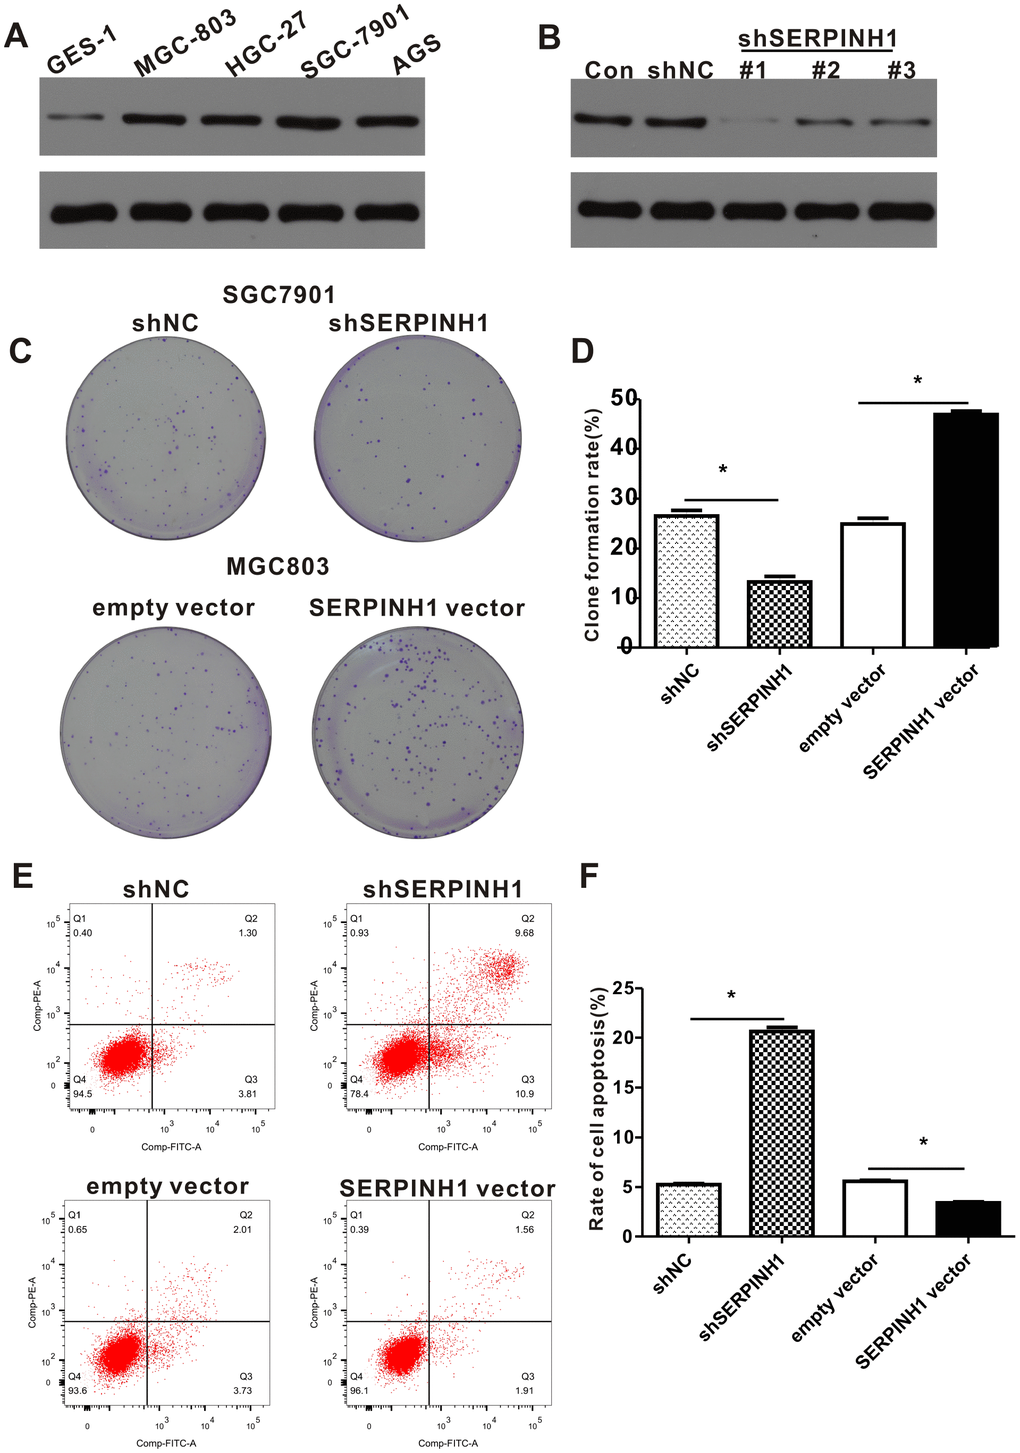
Figure 6.SERPINH1 expression regulates the proliferation and survival of GC cell lines. (A) Western blot analysis shows that SERPINH1 protein levels are higher in the four GC cell lines, HGC-27, AGS, MGC-803, SGC-7901, compared to the normal gastric mucosal cell line, GES-1. (B) Western blot analysis shows that SERPINH1 protein levels are significantly reduced in shSERPINH1 #1-transfected SGC-7901 cells compared with SGC-7901 cells transfected with shSERPINH1 #2, shSERPINH1 #2, and shNC. (C) Representative images of colonies in shSERPINH1#1-transfected SGC-7901 cells, SERPINH1-overexpression vector transfected MGC-803 cells, and their corresponding controls. (D) Histogram plots show the number of colonies in shSERPINH1#1-transfected SGC-7901 cells, SERPINH1-overexpression vector-transfected MGC-803 cells, and their corresponding controls. (E) Flow cytometry analysis shows that apoptotic rate is significantly higher in the shSERPINH1#1-transfected SGC-7901 cells and significantly lower in the SERPINH1-overexpression vector-transfected MGC-803 cells compared to their corresponding controls. (F) Histogram plot shows the percentage of apoptotic cells in shNC-, and shSERPINH1#1-transfected SGC-7901 cell cultures, as well as, empty vector and SERPINH1-overexpression vector-transfected MGC-803 cells.