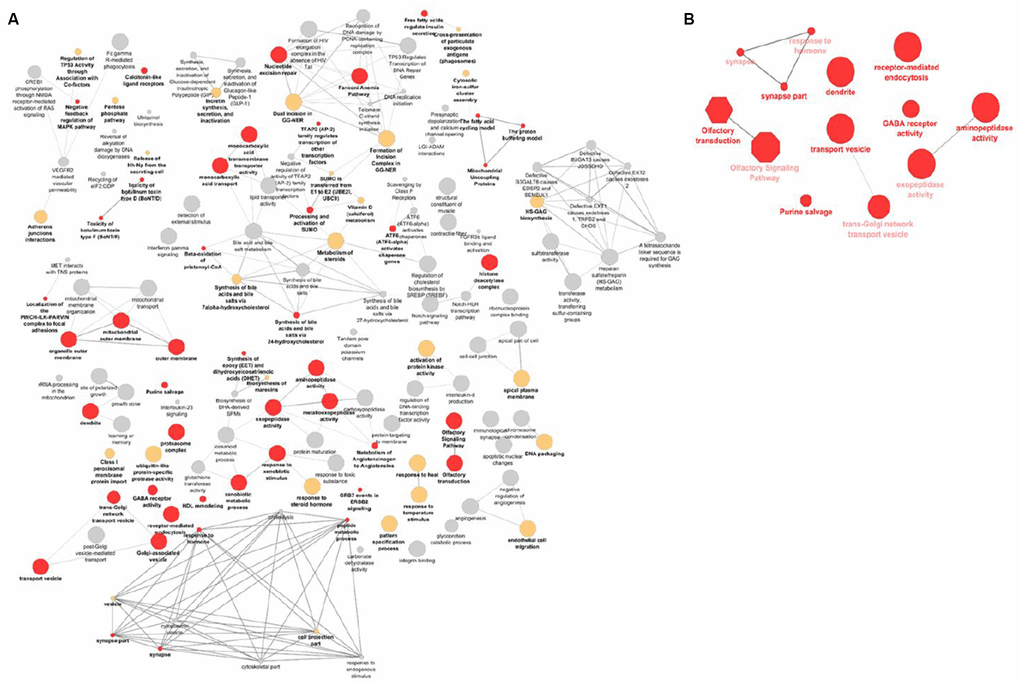
Figure 3.Visualization of the gene-sets and pathways enriched in primary GSEA analysis (A) and replicated in VEGAS and PASCAL (B). The size of the nodes corresponds to the number of the genes associated with a term. The significance is represented by the color of the nodes (P < 0.05, 0.05 < P < 0.1 and P > 0.1 are represented by red, yellow and gray, respectively).