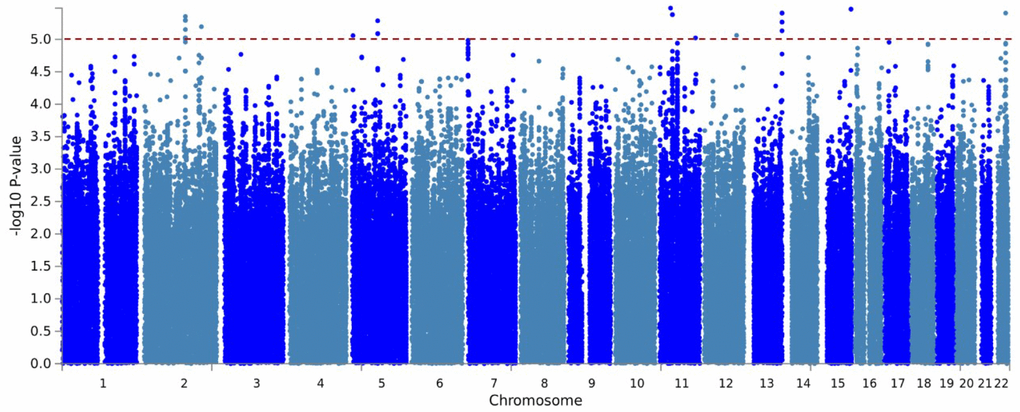
Figure 2.Manhattan plot of the GWAS for residual AO of MJD. Imputed using the HRC panel, 6,716,580 variants that passed QC are included in the plot. The x-axis shows the physical position along the genome. The y-axis shows the −log10(p-value) for association. The red line indicates the level of genome-wide suggestive association (P = 1 × 10⁻⁵).