Submit an Article
Navigate
Home
Editorial Board
Editorial Policies
Current Volume
Archive
Scientific Integrity
Publication Ethics Statements
Interviews with Outstanding Authors
Newsroom
Sponsored Conferences
Podcast
Contact
Special Collections
Submit an Article
Online ISSN: 1945-4589
Research Paper
|
Volume 12, Issue 6
|
pp. 4742–4756
Genome-wide association study identifies genetic factors that modify age at onset in Machado-Joseph disease
Back to article
Figure 1
(1 of 3)
−
100%
+
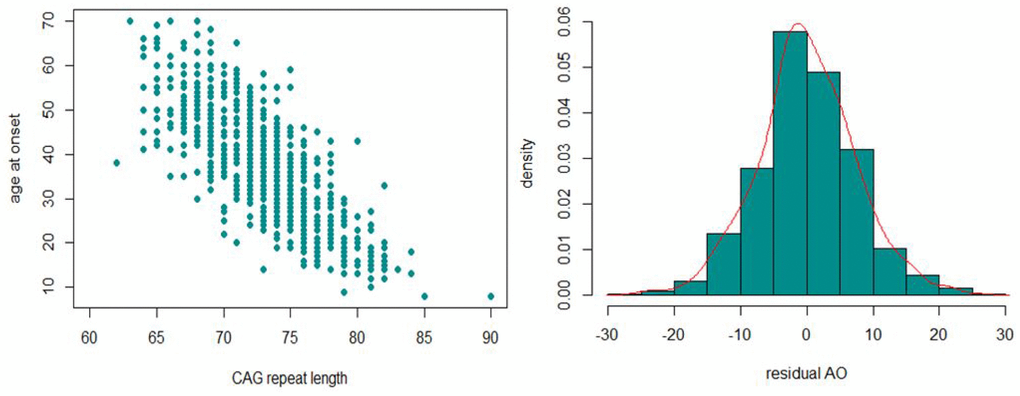
Figure 1.
The inverse correlation between CAG
exp
and AO (left) and the distribution of residual AO (right) observed in our MJD cohort.