Submit an Article
Navigate
Home
Editorial Board
Editorial Policies
Current Volume
Archive
Scientific Integrity
Publication Ethics Statements
Interviews with Outstanding Authors
Newsroom
Sponsored Conferences
Podcast
Contact
Special Collections
Submit an Article
Online ISSN: 1945-4589
Research Paper
|
Volume 12, Issue 4
|
pp. 3473–3485
Transcriptomic and metabolomic profiling of long-lived growth hormone releasing hormone knock-out mice: evidence for altered mitochondrial function and amino acid metabolism
Back to article
Figure 3
(3 of 5)
−
100%
+
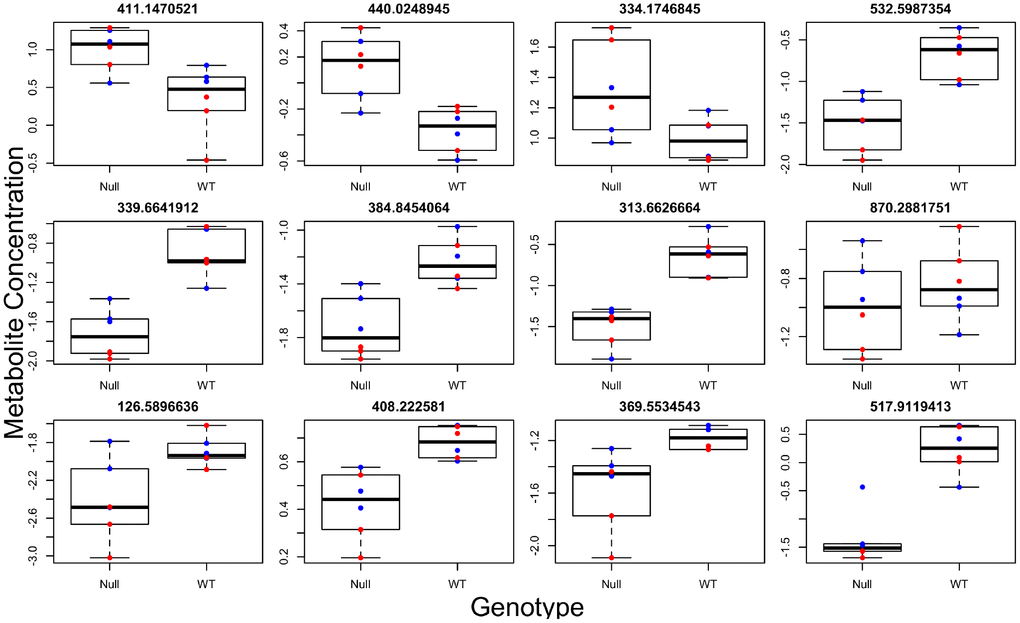
Figure 3.
Individual metabolites changed in GHRH-KO mouse blood serum compared to control mice.
Titles give the mass to charge ratio for each individual metabolite.