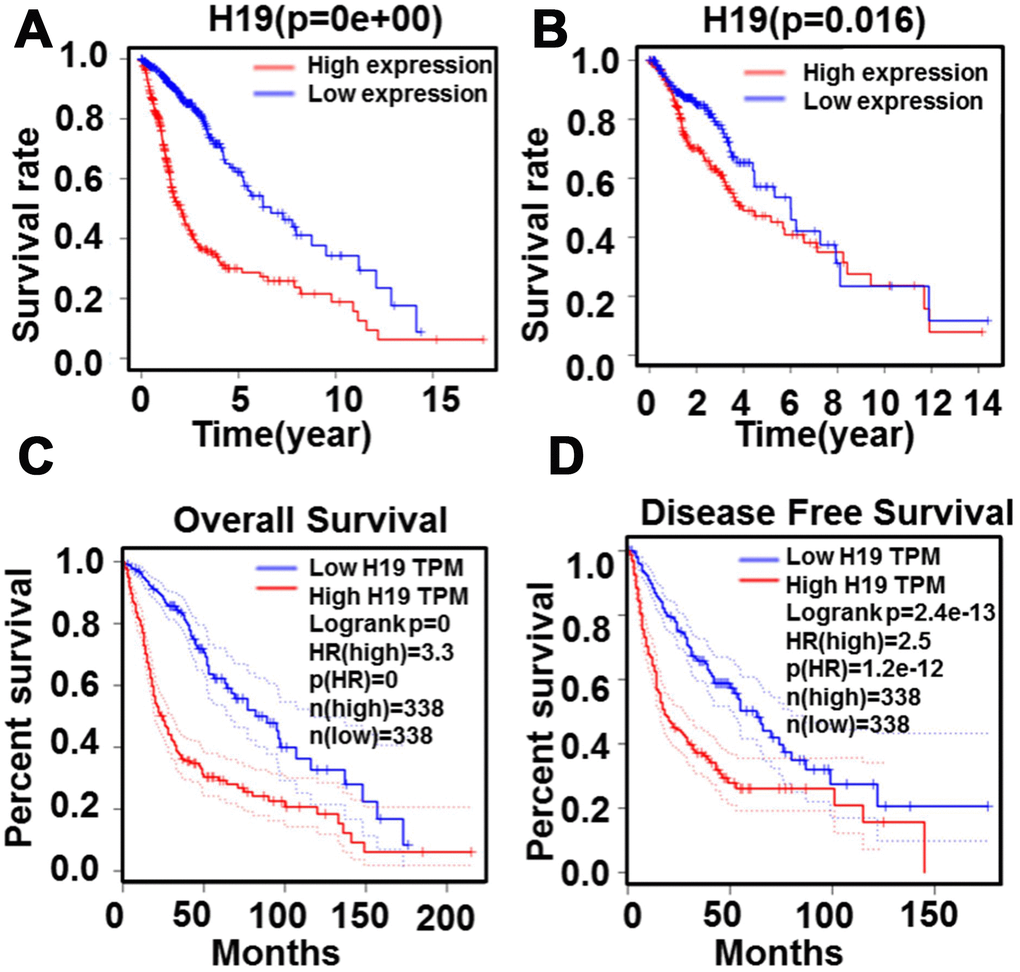
Figure 11.Relationship between H19 expression levels and survival rate in glioma as analyzed by Kaplan-Meier. (A) and (B) The relationship between survival rate and H19 expression level. (C) The relationship between overall survival and H19 expression level (D) The relationship between disease free survival and H19 expression level.