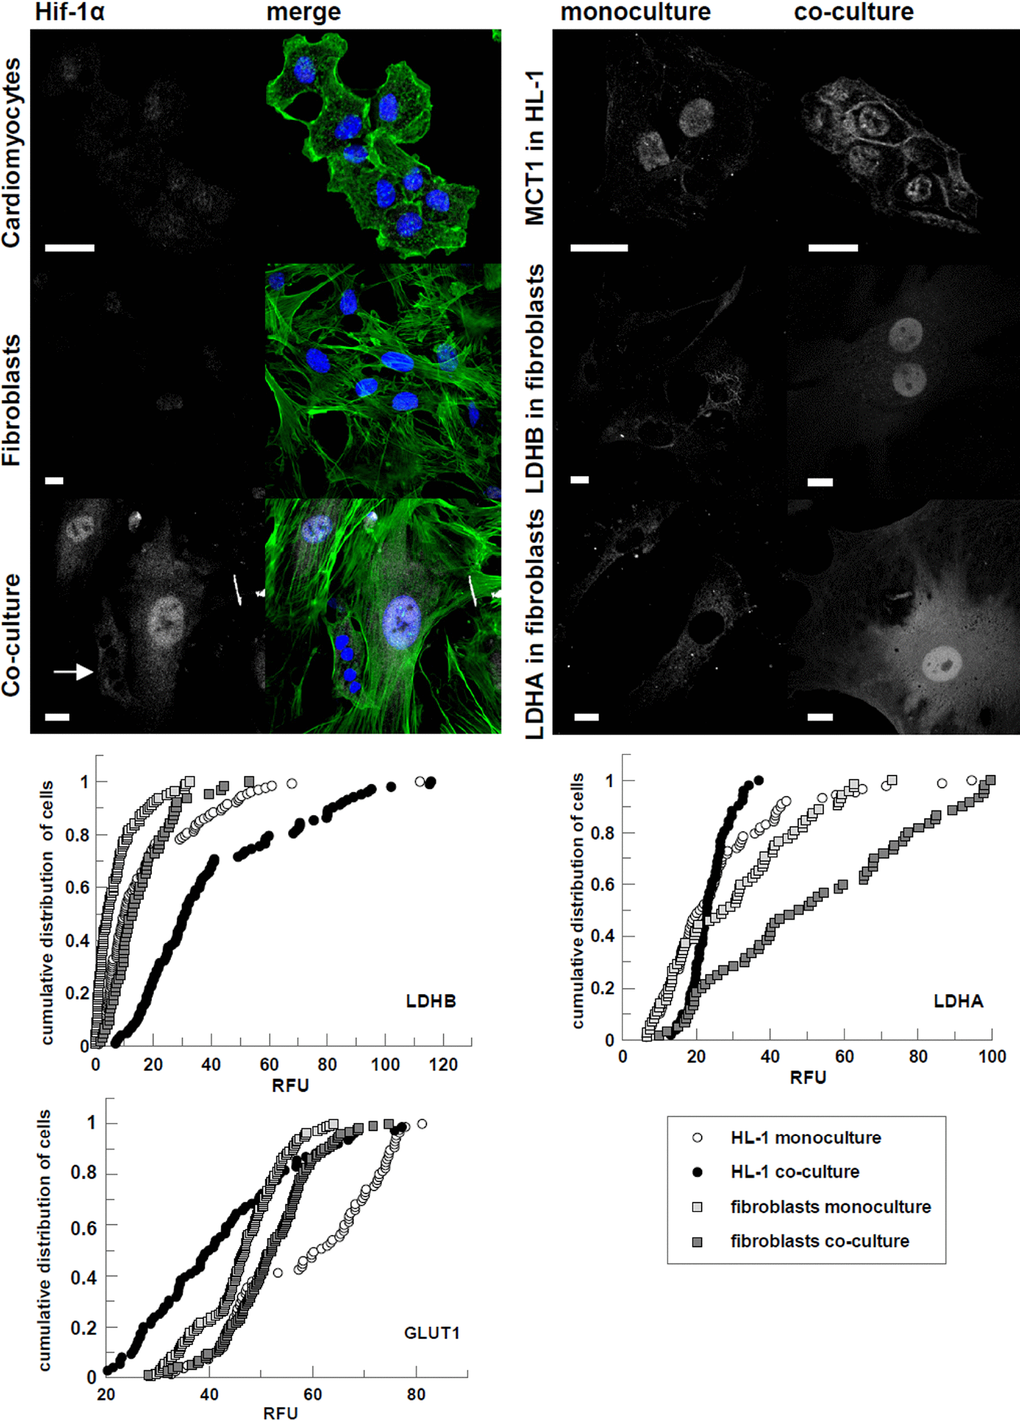
Figure 2.Changes in subcellular localization and immunostaining intensity of HIF-1α and proteins involved in glucose transport, and lactate transport and production evoked by cardiomyocytes-fibroblasts co culture. On merged pictures actin appears green and nuclei are shown in blue. White arrows point to cardiomyocytes. Bar = 20 μm. If the changes in fluorescence subcellular distribution were not evident, corrected total cell fluorescence of individual cells was calculated and presented in percentage frequency graphs. RFU – relative fluorescence units.