Submit an Article
Navigate
Home
Editorial Board
Editorial Policies
Current Volume
Archive
Scientific Integrity
Publication Ethics Statements
Interviews with Outstanding Authors
Newsroom
Sponsored Conferences
Podcast
Contact
Special Collections
Submit an Article
Online ISSN: 1945-4589
Research Paper
|
Volume 12, Issue 4
|
pp. 3312–3339
Analysis of immune-related signatures of lung adenocarcinoma identified two distinct subtypes: implications for immune checkpoint blockade therapy
Back to article
Figure 6
(6 of 6)
−
100%
+
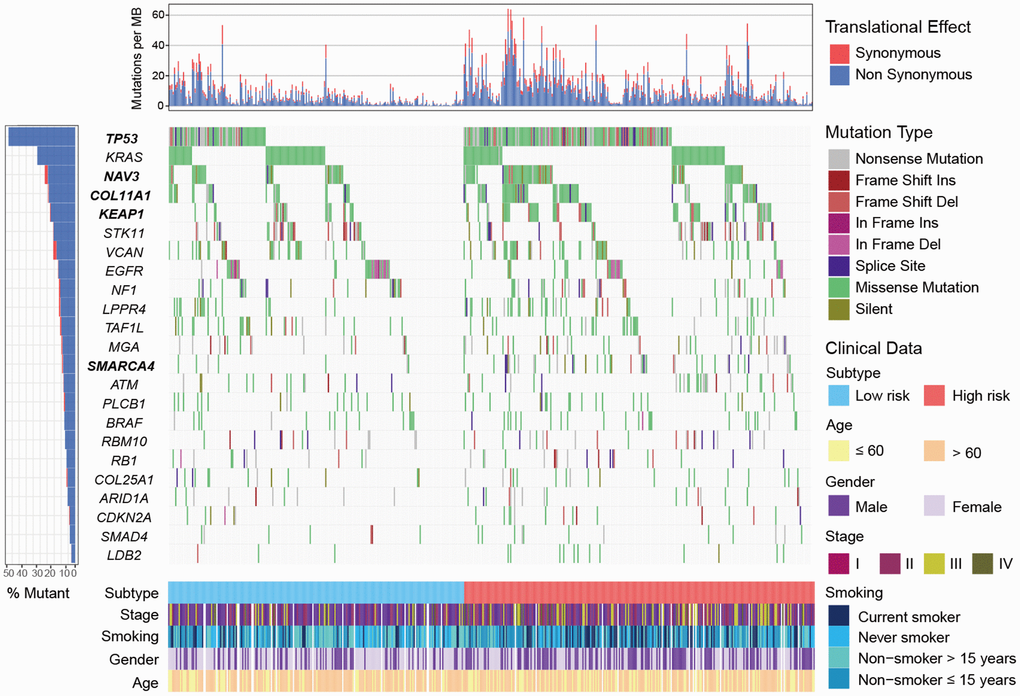
Figure 6.
Mutational landscape of SMGs in TCGA LUAD cohort stratified by high-/low-risk subtypes.
SMGs with significantly different mutation rate were highlighted in bold.